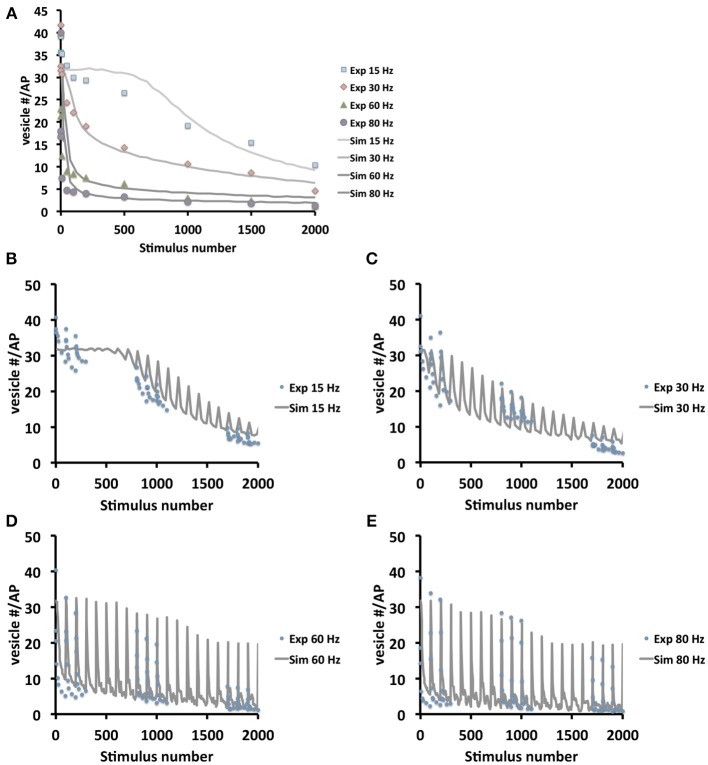
Figure 4.
Model validation at different frequencies and stimulation protocols. (A) Comparison between experimental and simulated data at the frequencies 15, 30, 60, and 80 Hz. In order to compare simulation and experiment, the initial vesicle density was computed from the experimentally recorded vesicle release for each frequency and thus initial vesicle densities were set to 500, 280, 190, and 150 vesicles/μm3 respectively in the simulations. Note that in the beginning 1000 stimuli at 15 Hz the depletion is considerably faster in real boutons than in the simulation. This may indicate that 15 Hz stimulation is initially not sufficient to efficiently mobilize all presynaptic vesicles e.g., from the reserve pool of vesicles. This limitation is overcome at higher stimulation frequencies. (B–E) Experimental (dotted) and simulation (lines) data in stop and go stimulation protocol, with 100 stimuli and 5 s pause, show decline in in the postsynaptic amplitudes (B,C: simulation data averaged over 25 stimuli; D,E: simulation data averaged over 5 stimuli). The plots show that with increasing frequency (from B–E) amplitudes decrease slower, due to higher exocytosis failure rates at high frequencies caused by diffusion limited active zone replenishment. Note that similar to (A) the experimental depletion is faster than the in silico depletion. As above this may be due to a not efficient mobilization of presynaptic vesicles at 15 Hz.

