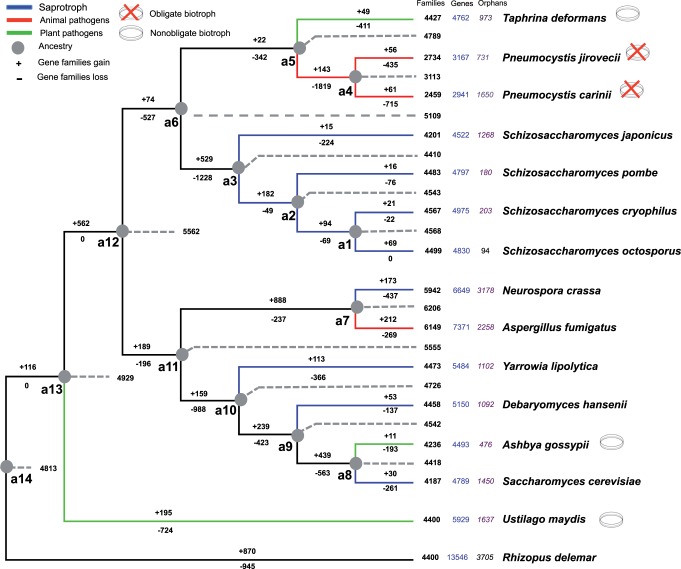
Fig. 1.—
Lifestyle and projected gene families’ gain and loss patterns in representative fungal genomes. The gene families’ loss and gain patterns are projected onto each branch of the species phylogeny. The fungal species phylogeny corresponds to a cladogram derived from the ML tree of our previous study (Cisse et al. 2012; supplementary fig. S3, Supplementary Material online). The numbers on the branch of the phylogenetic tree corresponds the gene families’ gains (+) and losses (−). The lifestyle of the different species is indicated by the color of the branch (blue for saprotrophs, red for animal pathogens, and green for plant pathogens). Biotrophic organisms are indicated by Petri dishes, red crosses indicating the absence of a culture system. Ancestral gene families’ content was reconstructed using the Dollo parsimony assumption (represented by the gray doted lines and the letter “a” which stands for ancestor). For each species, the number of gene families, genes, and orphan genes is displayed. The number of gene families is also displayed for inferred ancestral taxa.

