
Fig. 2.
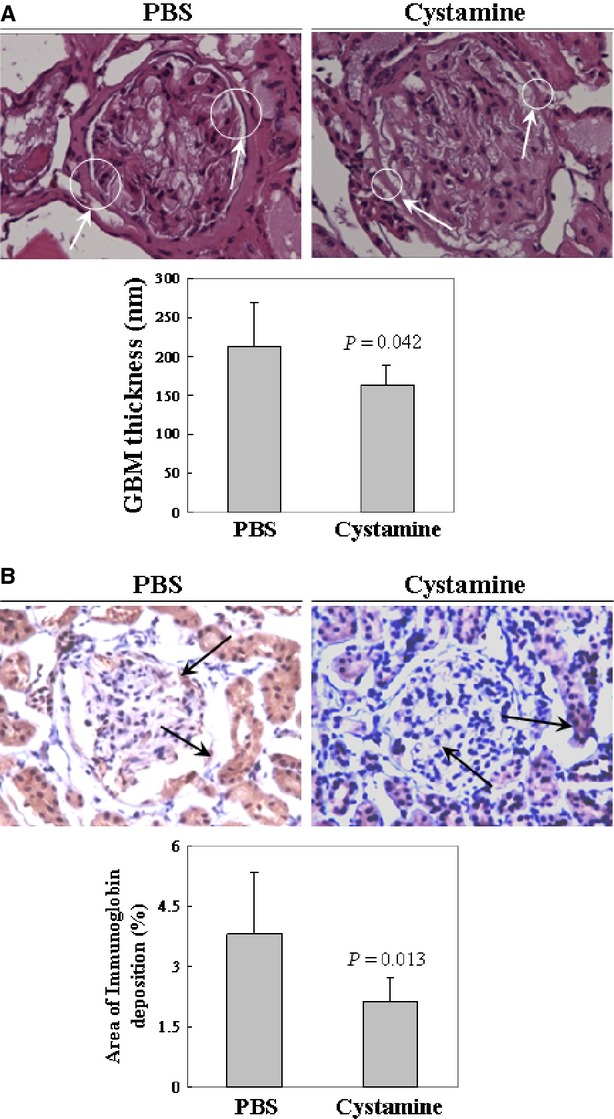
Kidney histopathological changes in NZB/W F1 mice. Histopathological analysis of kidney tissue sections with haematoxylin and eosin staining from NZB/W F1 mice. The images of kidney architecture were magnified by 400 times and (A) the glomerular basement membrane (GBM) thickening was indicated by arrows. Lower panel indicated the measurement of full GBM thickness. (B) The Immunoglobin deposition is indicated by arrows and the positive signal area is shown in the lower panel. A P < 0.05 was considered to be statistically significant. PBS: phosphate buffer saline; GBM: glomerular basement membrane.