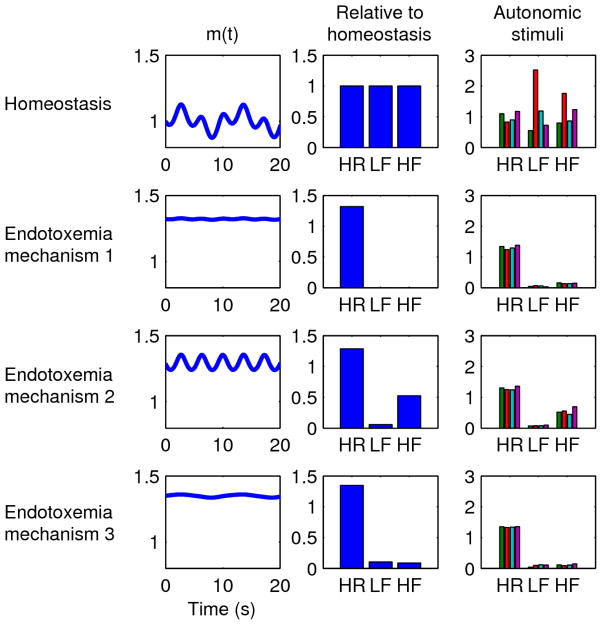
Figure 5.
Mechanisms for HR/HRV changes in endotoxemia. Each row represents a different simulation. The m(t) column shows the autonomic modulation of the heart as defined in Equation 2e based on the oscillations shown in the first two columns. The “Relative to homeostasis” column shows how HR, LF, and HF changed relative to homeostatic values in the first row. In all cases relative to homeostasis, HR increases while LF and HF decrease; the specific magnitudes of these changes (i.e. how much HR increases, etc.) can be tuned by the parameters of the model. The “Autonomic stimuli” column shows how HR, LF, and HF respond to 4 perturbations (as in Figure 4: increased sympathetic activity 50%, decreased sympathetic activity 50%, increased parasympathetic activity 50%, and decreased parasympathetic activity 50%, respectively) to quantify the level of uncoupling between the autonomic nervous system and the heart, again shown relative to homeostatic values. Uncoupling is indicated by relative insensitivity to autonomic stimuli. First row: homeostasis. Second row: endotoxemia mechanism 1, where sympathetic and parasympathetic activities increase and saturation of receptors leads to uncoupling. Third row: endotoxemia mechanism 2, where sympathetic activity increases, parasympathetic activity decreases (or increases), and uncoupling is due to a loss of sensitivity of the heart to autonomic stimuli. Fourth row: endotoxemia mechanism 3, where autonomic activities are uncoupled from the heart due to a loss of sensitivity but non-autonomic factors still increase HR.

