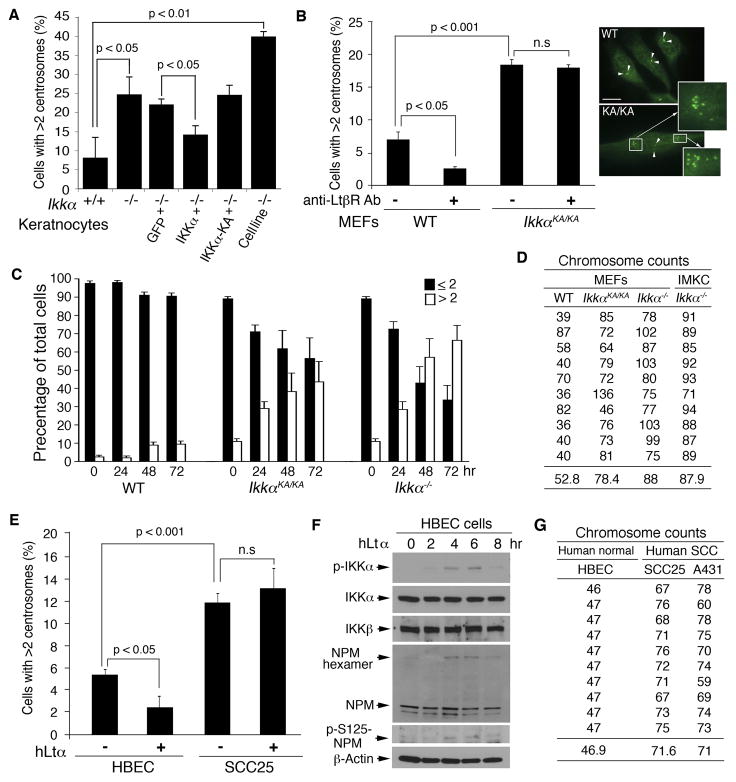
Figure 4. IKKα Deficiency Is Associated with Centrosome Amplification and Increased Chromosome Numbers.
(A) Centrosome numbers in primary cultured WT (+/+) and Ikkα−/− (−/−) keratinocytes and Ikkα−/− immortalized keratinocytes (Cell line) detected by IF staining. p value was determined by Student’s t-test. The results are presented as mean ± SD from 3 experiments.
(B) Left: Comparison of untreated and anti-LtβR antibody (500 ng/ml) treated WT and IkkαKA/KA (KA/KA) MEFs containing more than two centrosomes detected by IF staining. The statistical result (p) was analyzed by Student’s t-test. n.s, no significant difference. The results are presented as mean ± SD from 3 experiments. Right: Stained centrosomes (green) indicated by arrows. Multiple centrosomes are enlarged from small boxes to large boxes (arrows). Scale bars, 10 μm.
(C) Analysis for centrosome duplication in WT, IkkαKA/KA and Ikkα−/− MEFs treated with 2 mM hydroxyurea. Centrosome numbers were analyzed by staining with anti-γ-tubulin antibody. Black column, cells containing one or two centrosomes; White column, cells containing more than two centrosomes. The results represent as average ± SD from 3 experiments.
(D) Comparison of chromosome numbers from 10 cells in each type of cells: WT, Ikkα−/−, and IkkαKA/KA MEFs, as detected by SKY.
(E) Centrosome numbers in HBEC and SCC25 cells treated with hLtα (50 ng/ml) detected by IF staining. n.s, no significant difference. The results are presented as mean ± SD from 3 experiments.
(F) Western blot shows the indicated protein levels in HBEC cells treated with hLtα (50 ng/ml). β-Actin, protein loading control.
(G) Comparison of chromosome numbers from 10 cells in each type of cells: HBEC, A431, and SCC25 cells as detected by SKY. See also Figure S4.

