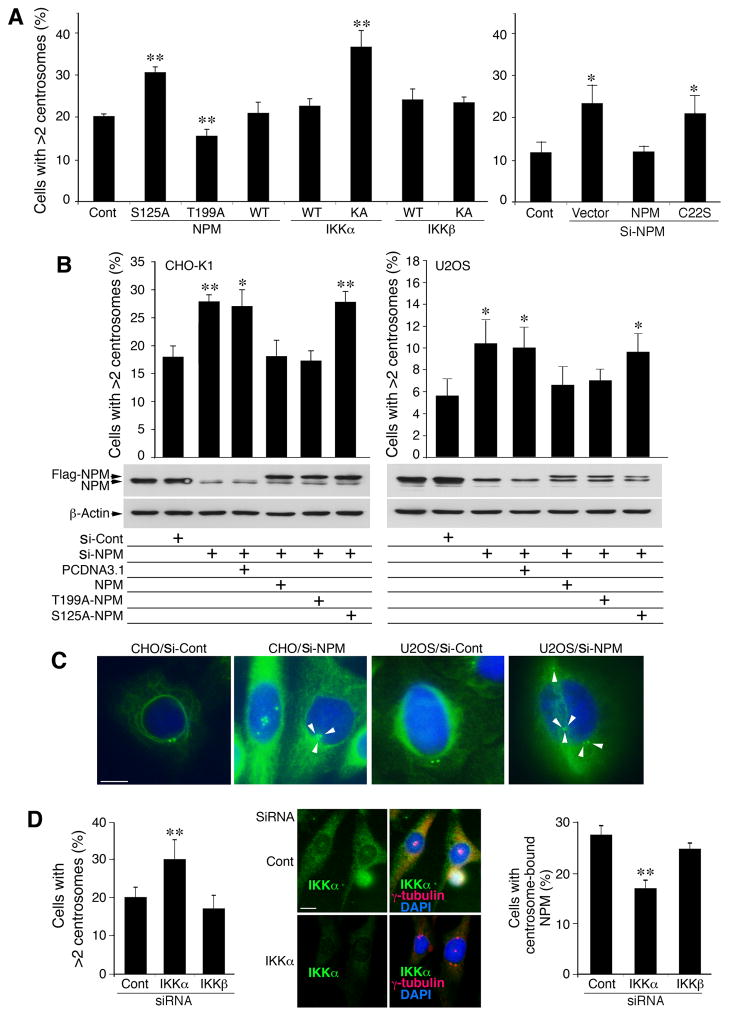
Figure 5. S125 of NPM Suppresses Centrosome Amplification.
(A) Effects of NPM, NPMS125A (S125A), NPMThr199A (T199A), IKKα, IKKα-KA, IKKβ, IKKβ-KA, and NPMC22S (C22S; see Figure S6A) on centrosome amplification in CHO cells. Each bar is compared to the control (Cont, untreated cells). Si-, siRNA; Cont, untreated cells. **, p < 0.01; *, p < 0.05 examined by Student’s t-test. Bar graphs are presented as mean ± SD from 3 experiments.
(B) Top: Effects of WT NPM, NPMS125A (S125A) and NPMThr199A (T199A) on centrosome amplification in CHO and U2OS cells lacking endogenous NPM. Each column is compared to the control (Cont). Si-, siRNA. **, p < 0.01; *, p < 0.05 examined by Student’s t-test. Bar graphs are presented as mean ± SD. Middle and bottom: western blot shows NPM and Flag-NPM levels in cells treated with NPM siRNA (si-NPM), control siRNA (si-Cont) or overexpression of Flag-NPM, T199A-NPM or S125A-NPM. PCDNA3.1, vector control.
(C) Centrosomes in CHO and U2OS cells treated with NPM siRNA or control siRNA were stained with IF with anti-γ-tubulin antibody (green). Blue, DAPI for nuclear staining. Scale bar, 10 μm.
(D) Left: Effects of reduced IKKα on centrosome amplification in CHO cells treated with IKKα siRNA, IKKβ siRNA or control siRNA (Cont). Middle: Reduced endogenous IKKα expression and increased centrosome numbers in CHO cells treated with IKKα siRNA (siRNA) or control siRNA (Cont), detected by IF staining. Scale bar, 10 μm. Right: Effects of IKKα siRNA and IKKβ siRNA on centrosome-bound NPM levels in CHO cells, detected by IF staining with antibodies against NPM and γ-tubulin. NPM colocalized with γ-tubulin was considered centrosome-bound NPM. **, p < 0.01 examined by Student’s t-test. Bar graphs are presented as mean ± SD from 3 experiments. See also Figure S5.

