Figure 5.
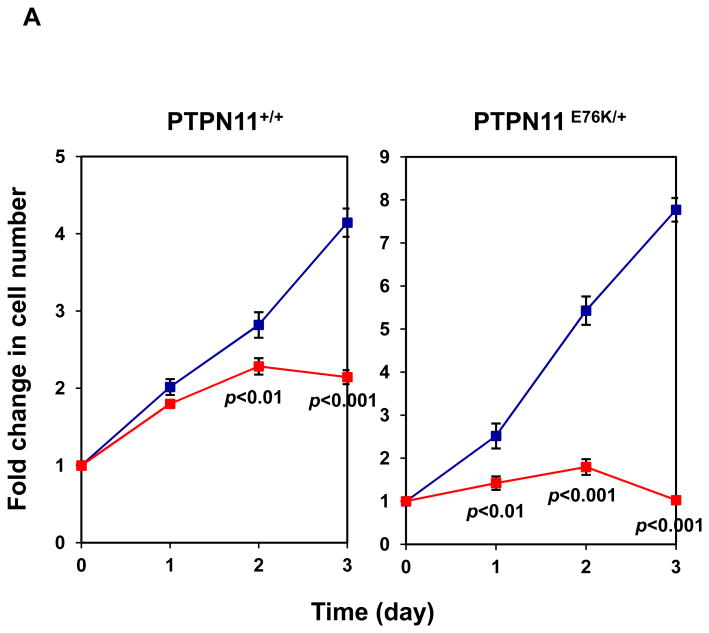
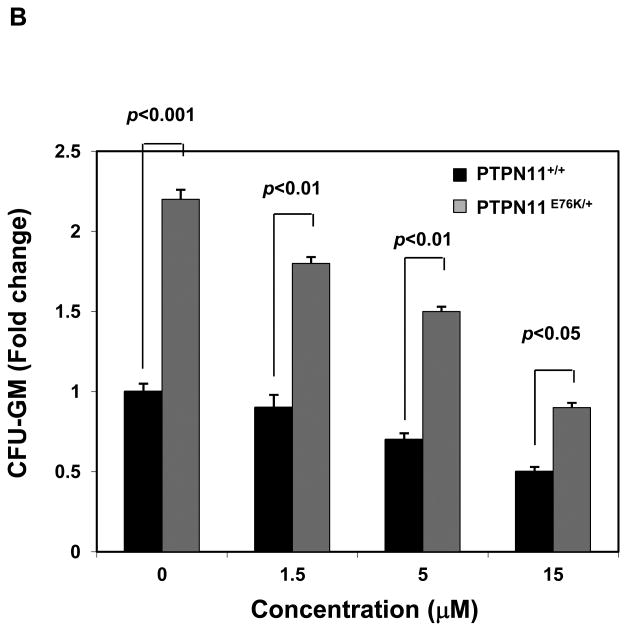
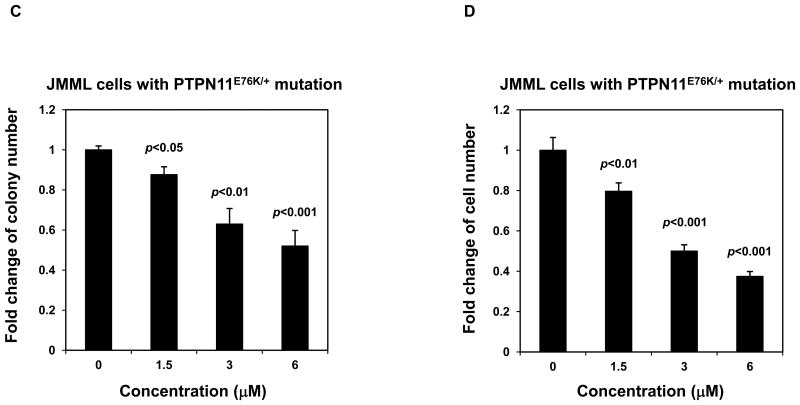
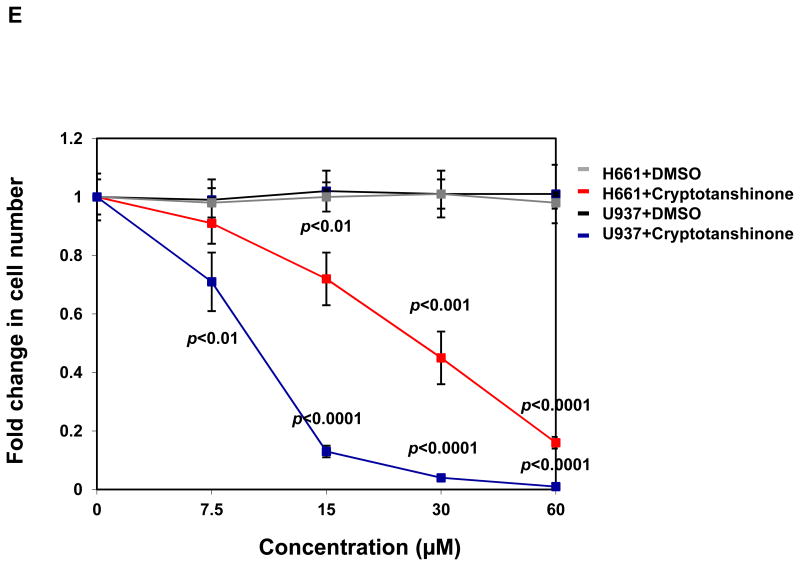
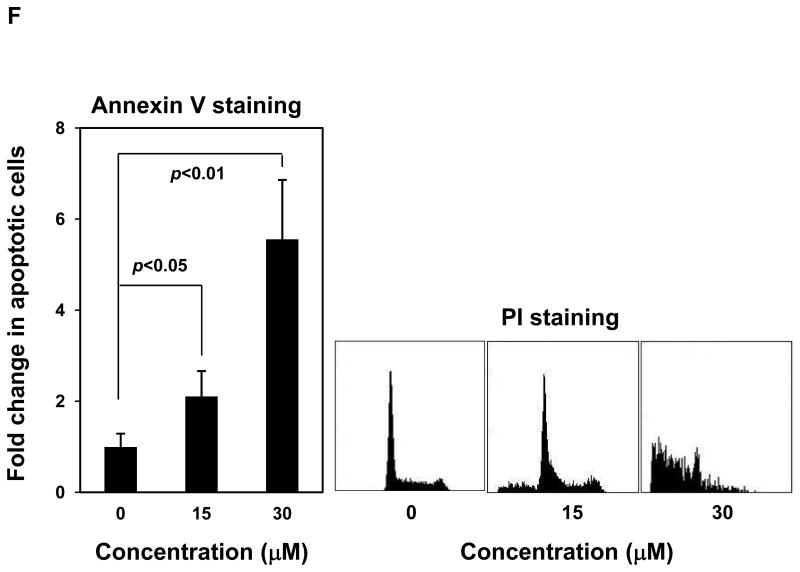
Mutant cells harboring hyperactivated SHP2 are more sensitive to Cryptotanshinone. (A) WT and PTPN11E76K/+ MEFs were cultured in 10% FBS-containing DMEM supplemented with Cryptotanshinone (20 μM). Cell numbers were determined using the One Solution Cell Proliferation Assay kit. Experiments were performed three times. Similar results were obtained in each. Data shown are mean±S.E.M. of triplicates from one representative experiment. (B) Bone marrow cells harvested from PTPN11E76K/+/Mx1-Cre+ and PTPN11+/+/Mx1-Cre+ mice were plated in methylcellulose medium containing GM-CSF (1.0 ng/mL) and Cryptotanshinone at the indicated concentrations or control DMSO. Colonies were enumerated 7 days later and normalized against the number of colonies derived from WT control cells treated with control DMSO. Representative results from two independent experiments are shown. Data are presented as mean±S.E.M. of triplicates. (C) Bone marrow cells or splenocytes from JMML patients with the PTPN11E76K/+ mutation were plated in methylcellulose medium containing GM-CSF (1.0 ng/mL) and Cryptotanshinone at the indicated concentrations or control DMSO. Colonies were enumerated 14 days later and normalized against the number of colonies derived from the cells treated with DMSO. Three patient samples were tested in three independent experiments. Similar results were obtained in each. Data are presented as mean±S.E.M. of triplicates from one patient sample. (D) Bone marrow cells or splenocytes from JMML patients with the PTPN11E76K/+ mutation were cultured in RPMI 1640 medium containing GM-CSF (1.0 ng/mL) and Cryptotanshinone at the indicated concentrations or control DMSO. Total cell numbers were determined and normalized against the number of the cells treated with DMSO. Three patient samples were tested in three independent experiments. Similar results were obtained in each. Data are presented as mean±S.E.M. of triplicates from one patient sample. (E) Human lymphoma cell line U937 with the PTPN11G60R/+ mutation and human lung cancer cell line H661 with the PTPN11N58S/+ mutation were incubated with Cryptotanshinone at the indicated concentrations for 48 hours. DMSO-treated cells were included as negative controls. Cell numbers were determined using the One Solution Cell Proliferation Assay kit. Experiments were repeated three times. Similar results were obtained in each. Data are presented as mean±S.E.M. of triplicates from one representative experiment. (F) U937 cells were incubated with Cryptotanshinone at the indicated concentrations. Apoptotic cells were quantified 24 hours later by FACS using an Annexin V staining kit following the instructions provided by the manufacturer. Cell cycle changes were determined by propidium iodide staining followed by FACS analyses 48 hours later. Experiments were performed three times. Data presented on the left panel are mean±S.E.M. of three experiments. Cell cycle profiles shown on the right panel are representatives of three independent experiments.

