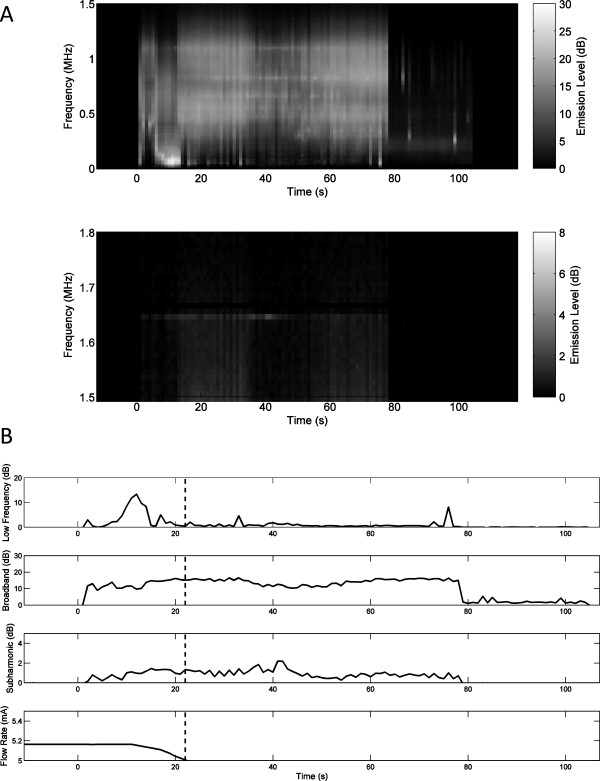
Figure 4.

Spectrogram of time-dependent passive cavitation detector signals and time-dependent acoustic emissions for trial 8. (A) Spectrogram of time-dependent passive cavitation detector signals (dB-scaled SNR) for trial 8 with 21,350 W/cm2 SPTP focal intensity. (B) Time-dependent acoustic emissions (dB-scaled SNR) and flow-meter output current for trial 8. The estimated time of vessel rupture is shown by the dashed vertical line.
