Figure 7.

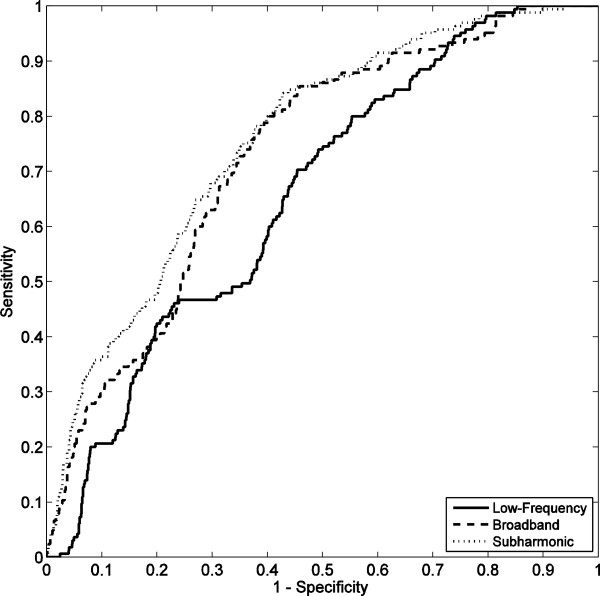
ROC curves for prediction of vessel rupture, based on 18 trials. Curves are shown quantifying rupture prediction performance based on low-frequency, broadband, and subharmonic emissions within 10 s before rupture.

ROC curves for prediction of vessel rupture, based on 18 trials. Curves are shown quantifying rupture prediction performance based on low-frequency, broadband, and subharmonic emissions within 10 s before rupture.