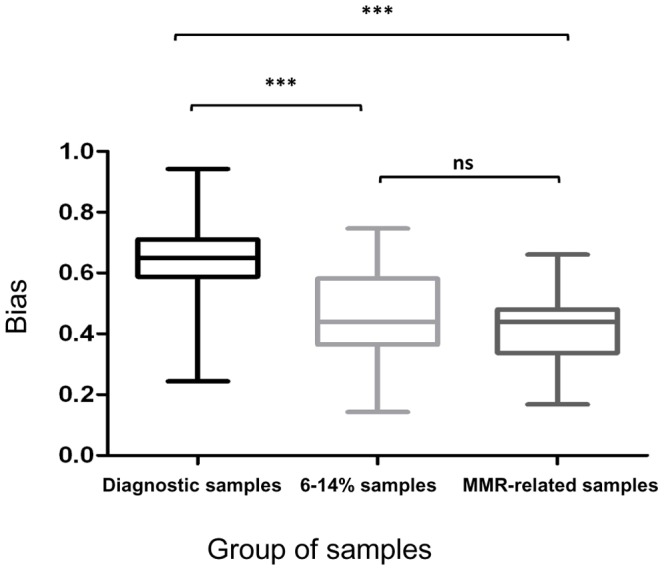
Figure 3. Box plot of the bias between (BCR-ABL1/ABL1)IS and BCR-ABL1/GUS measurement in the 3 groups of samples.

The bias (leading to conversion factor calculation) was compared between 3 groups of samples: diagnostic samples, samples with 6–14% and 0.1% transcript levels. It is significantly higher in the group of diagnostic samples (*** represents p-value<0.001; ns, non-significant).
