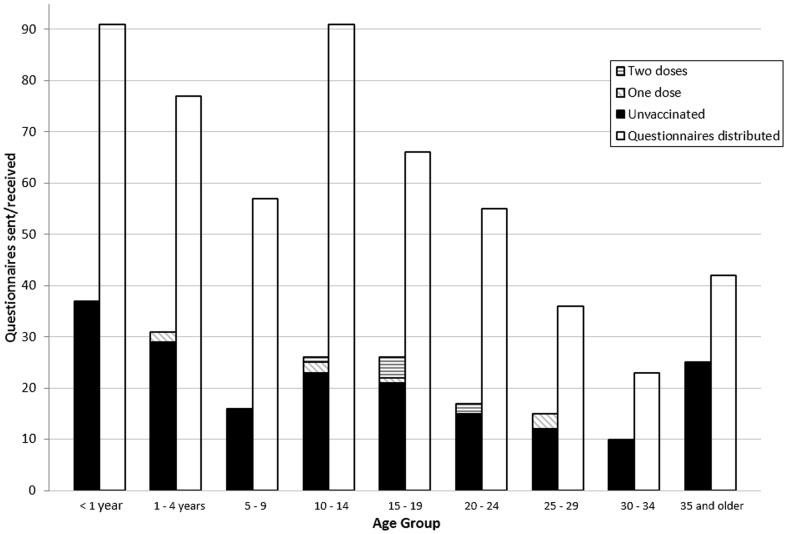
Figure 2. Age-specific distribution of questionnaires sent, questionnaire response, and vaccination status for confirmed cases of measles.
The right columns of each age group show the age-distribution of questionnaires sent to confirmed measles cases (left axis); the left columns show the age-distribution of responses (left axis), split into those who are have received no MMR vaccinations (black), one MMR vaccination (diagonal stripe) and two MMR vaccinations (horizontal stripe).

