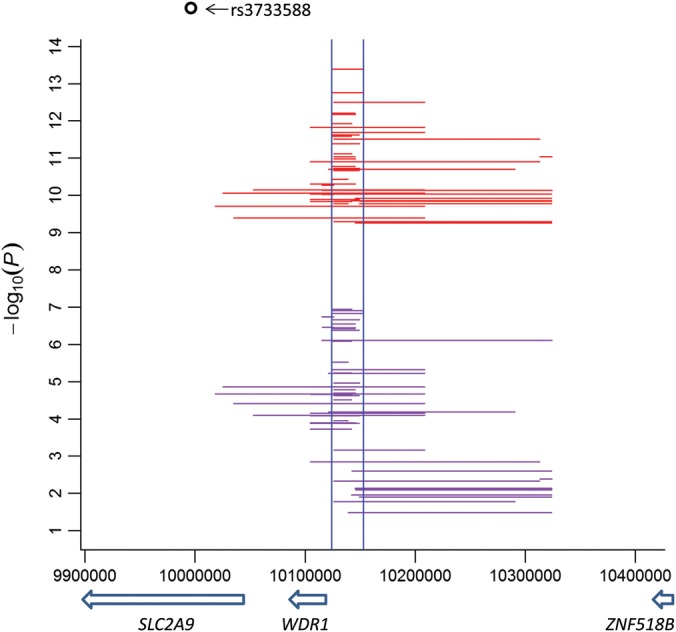
Figure 1.

Genome-wide significant SNP pairs in ARIC (red) and their replication (Pint < 0.05) in FHS (purple). Each horizontal line represents an interaction between two SNPs located at the start and end of the line; two vertical lines mark the 30-kb window described in the main text; y-axis: interaction P-values in the −log10 scale; x-axis: genomic location in base pair (UCSC hg19/NCBI 37.3); arrow bar showing transcription direction and location of the gene (italic) below the bar; rs3733588 is the lead GWAS SNP.
