Figure 4.

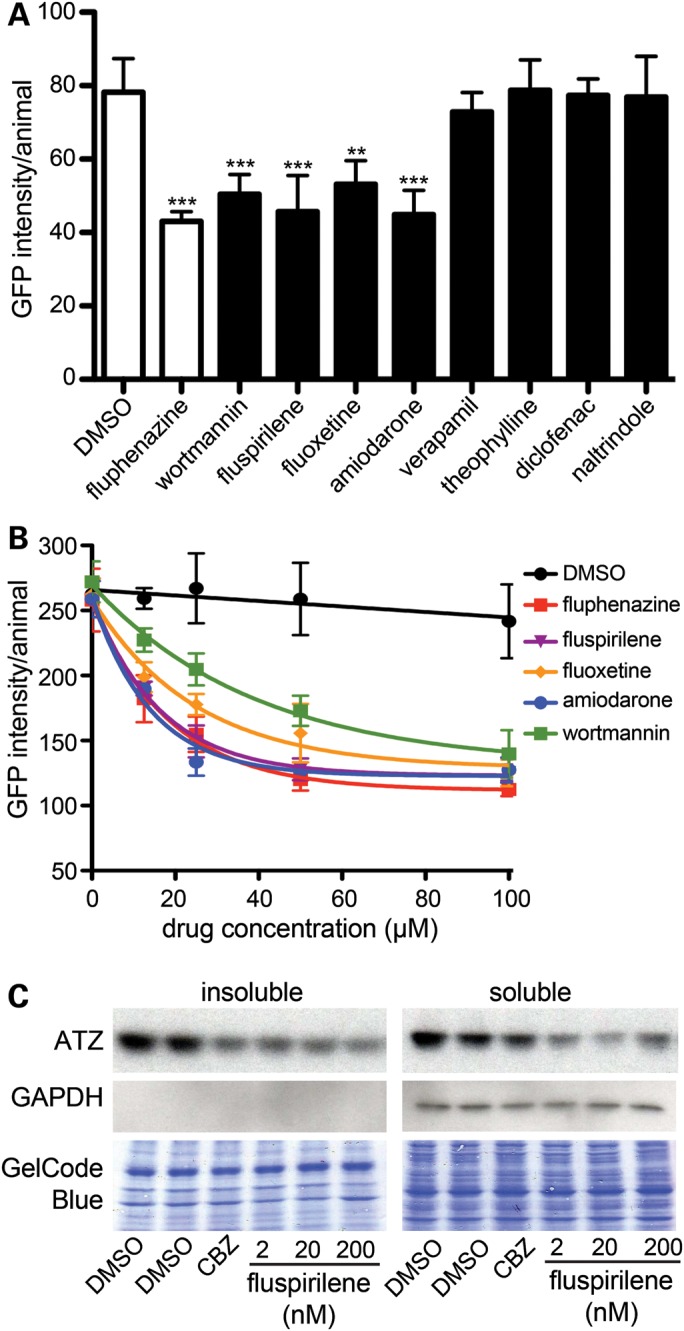
Drug–target analysis. (A) L4 GFP::ATZ animals were treated with 100 µm of each drug for 24 h and analyzed using the ArrayScan VTI. (B) Drug–dose response curves. The experiment was repeated three times, and a representative experiment shown. The error bars represent the SD of five replicate wells (n > 150 animals/treatment). Statistical significance was determined by using a Student's t-test. ***P < 0.001, **P < 0.01. (C) Effect of fluspirilene on steady-state levels of ATZ in a cell line model of ATZ. HeLa cells engineered to express ATZ (HTO/Z) were treated with DMSO, carbamazepine (CBZ) (positive control) or fluspirilene for 48 h. Lysates were prepared and separated into soluble and insoluble fractions. Samples were analyzed by immunoblotting with antibodies against AT (top) and GAPDH (middle). GAPDH is cytosolic marker and its absence in the insoluble fraction indicates correct fractionation. The blots were also stained with GelCode Blue (bottom) to demonstrate equal sample loading in each well.
