
Figure 1. Effect of Ad5hr infection on the number and function of circulating pDC.
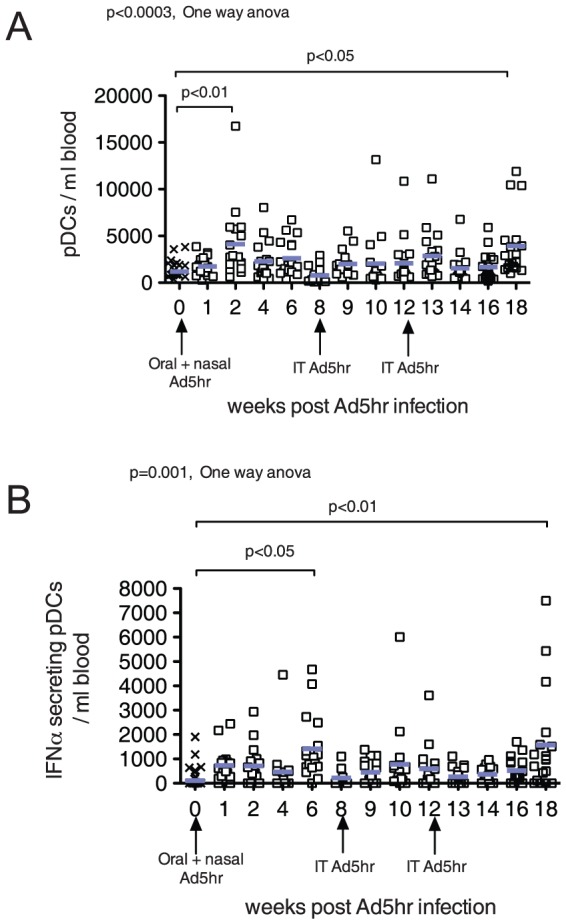
A) number of pDC per ml of blood. B) number of IFN-α secreting pDCs per ml of blood. Arrows on the X axis indicate the time of Ad5hr inoculation. The mean values for all animals are indicated by blue bars. P values ≤0.05 from the ANOVA and Dunnetts's post-hoc tests are shown.