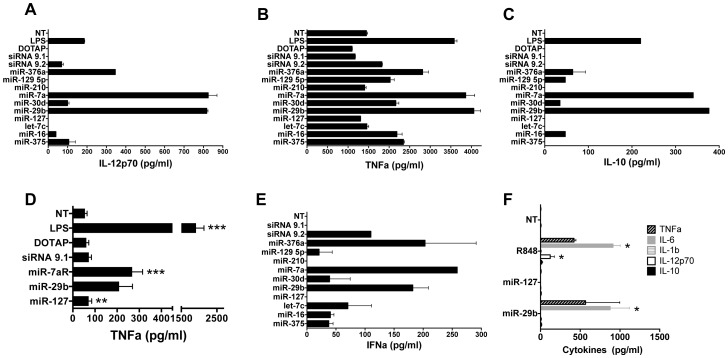
Figure 1. Cytokine secretion induced by miRNAs in vitro and in vivo.
Purified mouse CD11c+ bmDCs or RAW264.7 mouse macrophages were stimulated in vitro with miRNAs complexed to DOTAP at a working concentration of 150 nM (bmDCs) or 750 nM (macrophages, positive controls (siRNA9.2 or LPS), negative controls (siRNA9.1 or DOTAP alone) or were left untreated (NT). IL-12 (A), TNFa (B) and IL-10 (C) cytokine levels were assessed by ELISA in bmDC supernatants eighteen hours after stimulation. Results are presented as mean cytokine concentration of duplicates (pg/ml) ± SEM. Data from one representative experiment out of two is shown. (D) TNFa secreted by RAW264.7 macrophages was quantified in supernatants after eighteen hours of stimulation. Results compiled from four independent experiments are shown and analysed using a Kruskal-Wallis test (***P<0.001 and **P<0.01). (E) Serum IFNa in BALB/c mice was quantified by ELISA seven hours following intravenous injection of miRNAs complexed to DOTAP or controls. Results are presented as mean concentration of duplicates (pg/ml) ± SEM, and are confirmed in a second independent experiment (n = 4 total mice). (F) Serum IL-6, TNFa and IL-12 in BALB/c mice was quantified two hours following intravenous injection of miR-29b, the positive control R848, or the immune-silent miR-127 using a BD Cytometric Bead Array. Results are presented as mean concentration ± SEM (pg/ml) from two experiments (n = 4 total mice). IL-6: P<0.05 for miR-29b vs miR-127 and miR-127 vs R848; IL-12: P<0.05 for miR-127 vs R848 (Kruskal-Wallis).

