Figure 4.
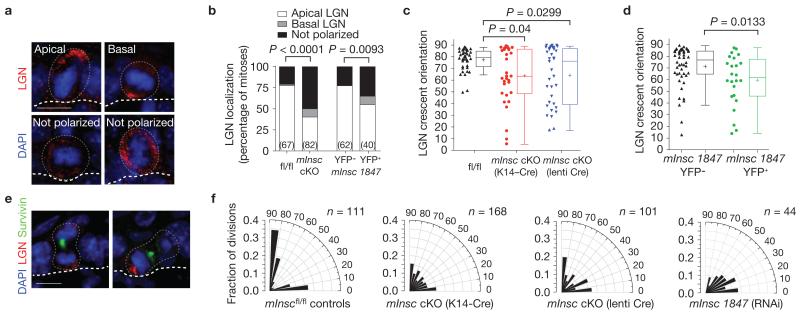
mInsc cKOs show impaired LGN localization and randomized spindle orientation. (a) In E17.5 mInsc cKOs, LGN localizes apically as in wild-type cells in a minority of cases (top left), but more frequently is mislocalized in one of three ways: mispositioned basal crescents (top right), weakly expressed (bottom left), or cortical but unpolarized (bottom right). (b) Quantification of LGN localization patterns in E17.5 mitotic basal cells. LGN is nearly always apical in control cells (76%), whereas this is less frequently observed (40%) in mInsc cKOs. Similar results are observed in mInsc knockdowns, comparing transduced (H2B–YFP+) with non-transduced internal (H2B–YFP−) controls. n (cells from >4 independent animals) indicated in parentheses. (c) Dot and Tukey box-and-whisker plots of LGN crescent orientation in E17.5 controls and mInsc cKOs. LGN crescents show a strong apical bias in controls, but are more broadly distributed in mInsc cKOs, regardless of whether transgenic K14–Cre (middle, red) or lentiviral-delivered Cre–mRFP1 (right, blue) is used. (d) LGN crescent orientation in mInsc-1847 shRNA H2B–YFP+ (right, green) and H2B–YFP− internal controls (left, black), as in c. (e) Abnormal LGN orientation persists into telophase in mInsc cKOs. Examples show LGN segregating equally into both daughter cells even in a perpendicular division (left), or erroneously segregating into the basal daughter (right). (f) Radial histograms of division angle orientations at E16.5–E17.5. Littermate mInscfl/fl controls (left) show a typical, largely ‘bimodal’ distribution with most divisions occurring close to perpendicular (~55–60%) or planar (30–35%) and few at oblique angles. When mInsc is deleted using either transgenic or lentiviral Cre, or knocked down by mInsc-1847 shRNA, division orientation becomes more randomized, with a higher proportion of oblique division angles. n indicates cells from 4 to 6 independent animals. Scale bars in a,e are 10 μm. P values were calculated by chi-square tests (b), or Mann–Whitney tests (c,d). Chi-square P-values related to (f) can be found in Supplementary Table 1. In c,d each data point represents one cell; data collected from n > 4 independent animals. Box boundaries indicate the 25% and 75% quartiles, the middle bar the median, and the plus symbol the mean.

