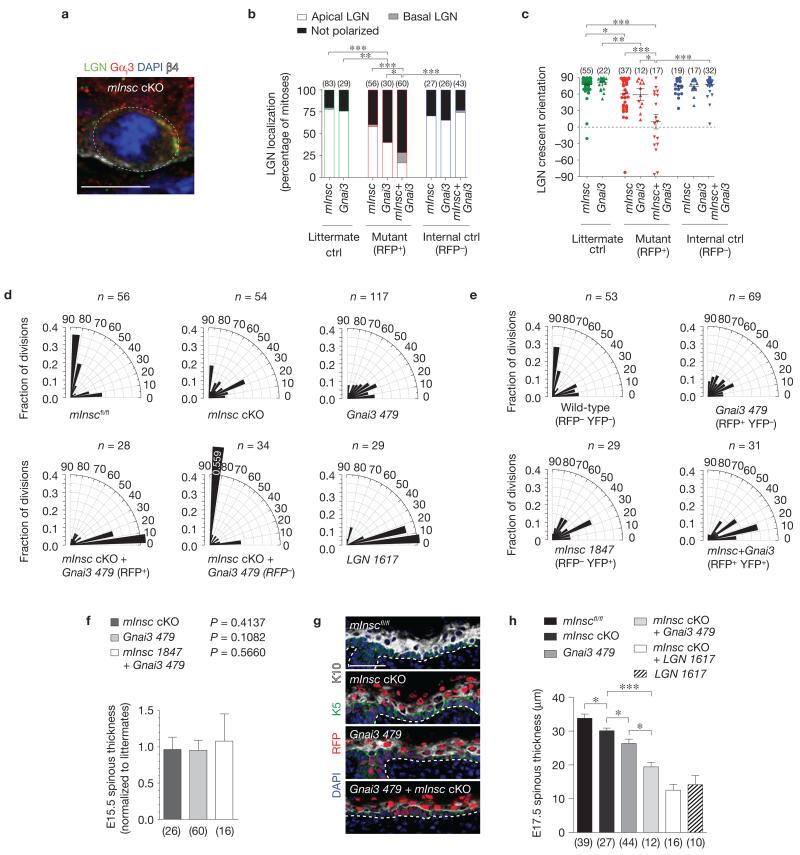
Figure 7.
Gαi3 and mInsc act cooperatively to localize LGN to the apical cortex. (a) Co-localization of LGN and Gαi3 in E16.5 mInsc cKO mitotic basal cells. Where LGN is polarized (n = 59 of 79 cells), Gαi3 co-localizes in the same cortical domain in 88% of cases, even when in ectopic locations as in b. (b,c) LGN localization at E17.5 becomes progressively impaired following loss of mInsc, Gnai3, and combined loss of mInsc+Gnai3. Littermates are shown in green, knockdown (RFP+) in red, and internal controls (RFP−) in blue. There is near complete loss of apical LGN in mInsc+Gnai3 mutants, and the few cells that can polarize LGN do so randomly. n indicates cells per condition from 3 to 6 independent animals. Mean ± s.e.m. shown in black. (d) Division angle orientation in E17.5 back skin (n indicates cells from 3 to 6 animals per group). Loss of mInsc or Gnai3 alone induces oblique divisions, whereas mInsc + Gnai3 loss shows a more severe phenotype of mostly planar divisions, as seen in LGN knockdowns. RFP− internal controls in the double mutant show a compensatory increase in perpendicular divisions. (e) E17.5 division orientation in embryos transduced with a mixture of Gnai3-479 shRNA H2B–RFP and mInsc-1847 shRNA H2B–YFP (n = cells from 4 animals). Double-knockdown (RFP+ YFP+) basal cells show an enhanced bias towards planar divisions as in mInsc cKO; Gnai3-479 shRNA basal cells. (f) As with LGN, Numa1 and AGS3 (Fig. 3h), loss of mInsc and Gnai3 alone or in combination does not alter early stratification, as measured by E15.5 spinous thickness. n indicates sections analysed from >4 animals per group. (g,h) Spinous differentiation (K10, white) in E17.5 head skin. Small but significant decreases in differentiation are observed in single mutants, whereas defects in mInsc; Gnai3 double mutants are comparable to LGN knockdowns. Note that loss of mInsc + LGN does not further enhance the LGN phenotype, consistent with LGN being epistatic to mInsc. n indicates sections analysed from >4 animals per genotype. Scale bars, 10 μm in a, 50 μm in g. Error bars: s.d. (f,h). P values: * P < 0.05, ** P < 0.01, *** P < 0.0001, as determined by chi-square (b), Mann–Whitney test (c) or two-tailed Student’s t-tests (f,h). Chi-square P values related to d,e are in Supplementary Table 1.

