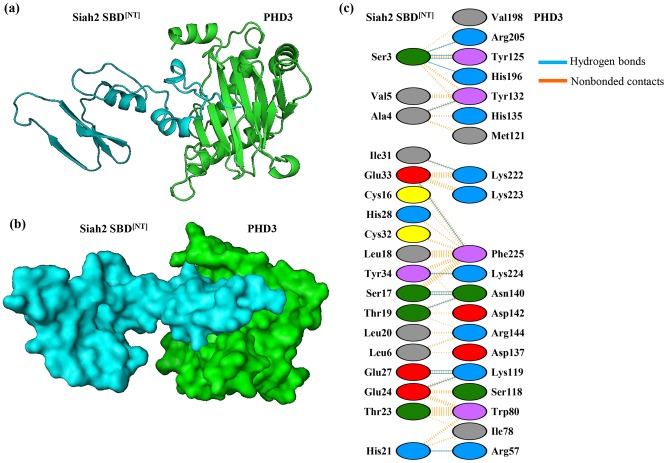
Figure 8. Docking model of the N-terminal Siah2 SBD and PHD3.
N-terminal region (1–100) of the modeled Siah2 SBD was docked with PHD3 using an automated Cluspro server. The complex was then presented using Pymol as (a) cartoon representation, and (b) space filling representation. (c) The details of the interactions were obtained by PDBsum. The number of H-bond lines between any two residues indicates the number of potential hydrogen bonds between them. For non-bonded contacts, the width of the striped line is proportional to the number of atomic contacts.

