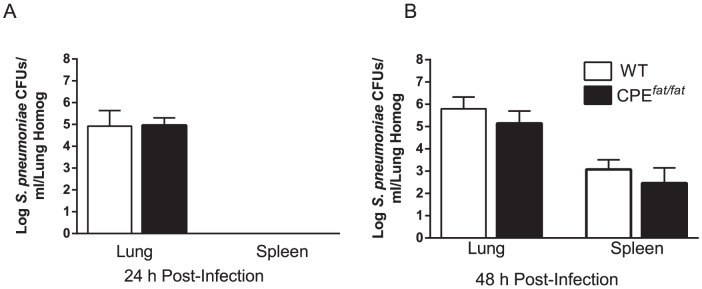
Figure 3. Bacterial burdens in WT and CPEfat/fat mice 24 (A) and 48 h (B) following S. pneumoniae challenge.

Mice were infected with 5×10⁴ CFUs of S. pneumoniae via the intratracheal route and bacterial loads in tissue homogenates were determined by enumerating CFUs as described in the Materials and Methods section. Statistical comparisons were performed using the students t-test. n = 5 (24 h) and 15 (48 h) mice per group.
