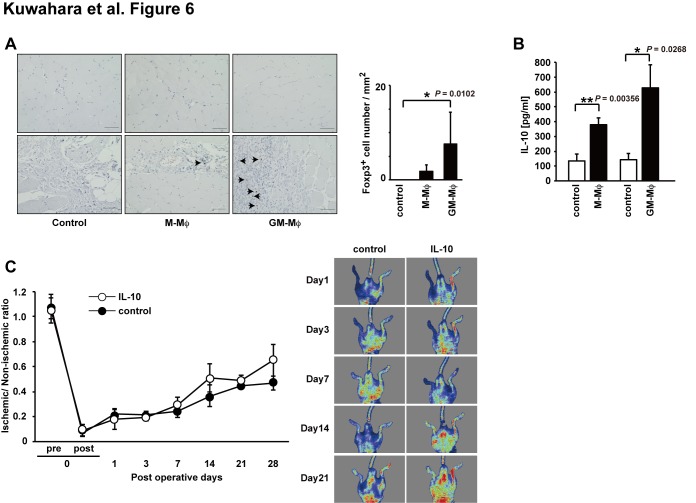
Figure 6. Foxp3 expression in M-Mø or GM-Mø treated ischemic hind limbs and the recovery of blood flow in ischemic limbs treated with IL-10.
(A) Photomicrographs show representative DAB staining for Foxp3 (scale bar = 50 µm). The number of Foxp3 positive cells was counted in five random images for each mouse. The thigh muscle of each group was isolated 7 days after the induction of ischemia. (B) IL-10 levels in thigh muscle after limb ischemia at 7 days after intramuscular injection of indicated cells (data are expressed as mean ± SEM, n = 3 group, ***P<0.001, **P<0.01, *P<0.05). (C) Recovery of blood flow in ischemic limbs treated IL-10. Representative laser doppler perfusion images were taken at indicated intervals for the PBS control groups and IL-10 treated groups. Data are expressed as mean ± SEM, n = 5–7/group.

