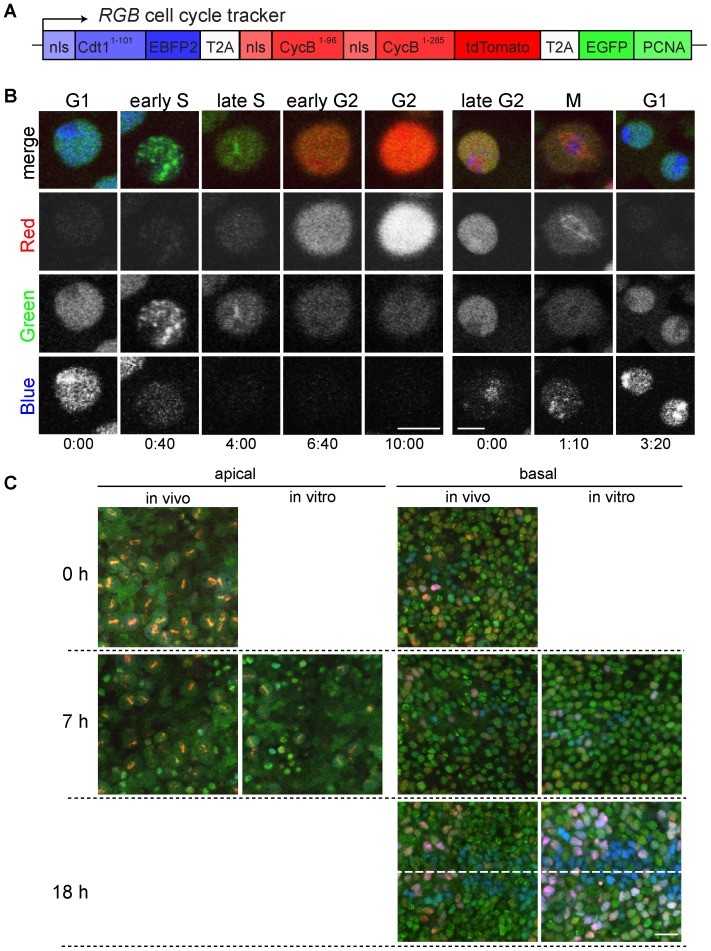
Figure 3. A novel RGB cell cycle tracker reveals inhibition of cell cycle progression in cultured discs.
(A) The transcript expressed from the RGB cell cycle tracker transgene generates three separate proteins because of the intervening T2A cis-acting hydrolase elements. The three proteins are fused to different fluorescent proteins, EBFP2 (blue), tdTomato (red) and EGFP (green). Their intracellular localization is dictated by nuclear localization signals (nls). Moreover, the PCNA part enforces localization in a subnuclear pattern during S phase. Degradation signals result in proteolysis during S phase (Cdt11–101) or late M and G2 (CycB1–96 and CycB1–285), respectively. (B) Time lapse in vivo imaging of peripodial cells in cultured en-GAL4 UAS-RGB wing imaginal discs. In the left series of still frames, a cell progressing from G1 through S into G2 is displayed. In the right series of still frames, a cell progressing from G2 through M into G1 is shown. Time is given in hours∶minutes. Scale bars = 5 µm. (C) The effect of culture on cell cycle progression was analyzed with nub-GAL4 UAS-RGB wing imaginal discs. Discs fixed immediately after dissection at 100, 107 or 118 hours AED are labeled "in vivo", while those dissected at 100 hours AED followed by cultivation for 7 or 18 hours before fixation are labeled "in vitro". Representative images of the central pouch region at either an apical focal plane containing mitotic cells (left side) or a basal focal plane with interphase cells in the disc proper (right side) are shown. The dashed line indicates the future wing margin. Scale bar = 10 µm.

