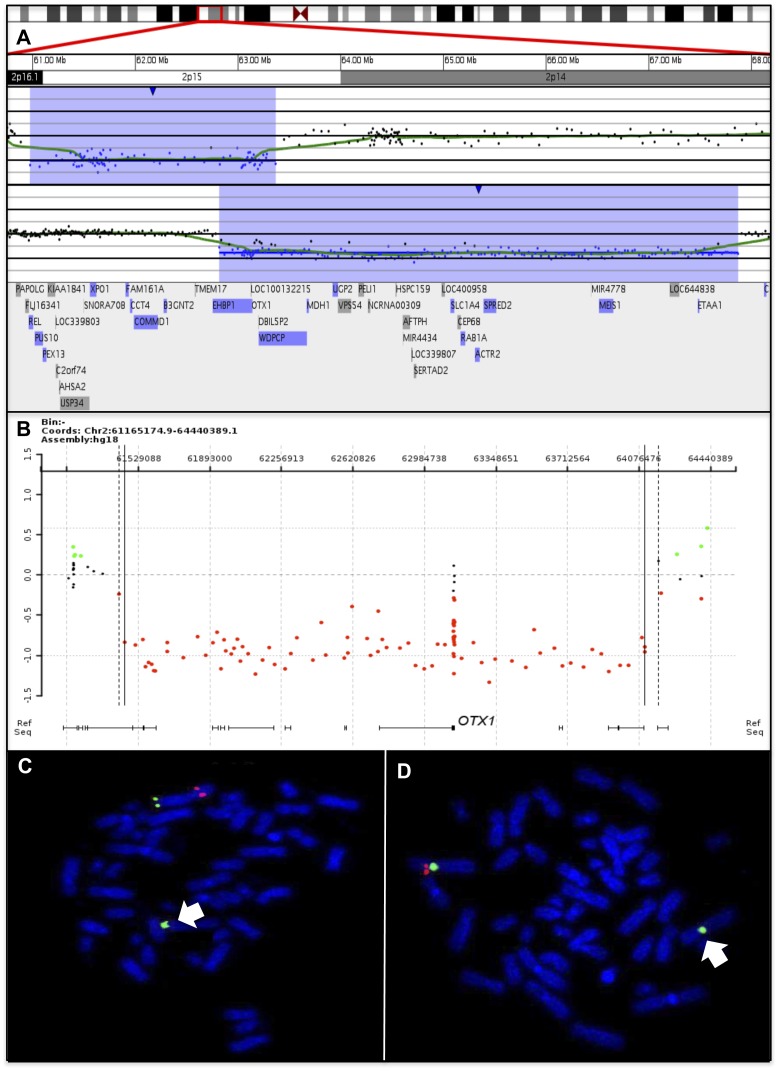
Figure 3. Clinical diagnostic arrays identify subjects with microdeletions in 2p15.
A) Signature Genomics array analysis revealed a microdeletion in 2p15 that encompasses OTX1 (red line) in subject-2 and -3. B) Baylor Clinical Genetics array revealed a microdeletion (red dots) in 2p15 that encompasses OTX1 in subject-6 (red box). Coordinates shown are according to the hg18 build of the human genome. C) Dual color FISH analysis using spectrum red labeled clone RP11-1073G3 and spectrum green labeled clone RP11-367H1 revealed the deletion of 2p15 on one homolog (arrow) in subject-2. D) Dual color FISH analysis using spectrum red labeled clone RP11-477N2 and spectrum green labeled clone D2Z2 revealed the deletion of 2p15 on one homolog (arrow) in subject-3.

