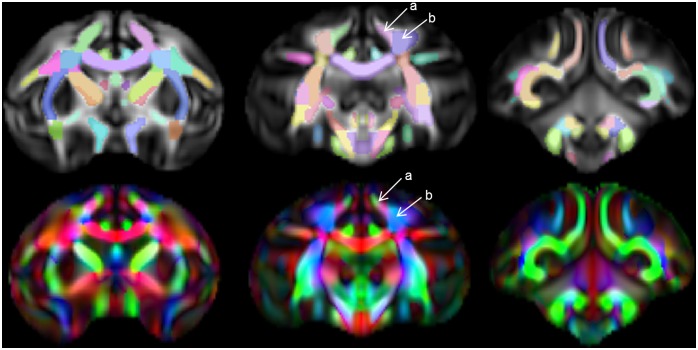
Figure 9. Delineation between tracts.

Top: FA maps of select slices of template (anterior on left, posterior on right) with atlas ROIs overlaid. Bottom: Color FA map of matching slices, showing delineation between tracts. Arrows indicate the division between the SCR (a) and the DPCR (b), and the directional (color) changes that guided the decision of where to put this boundary.
