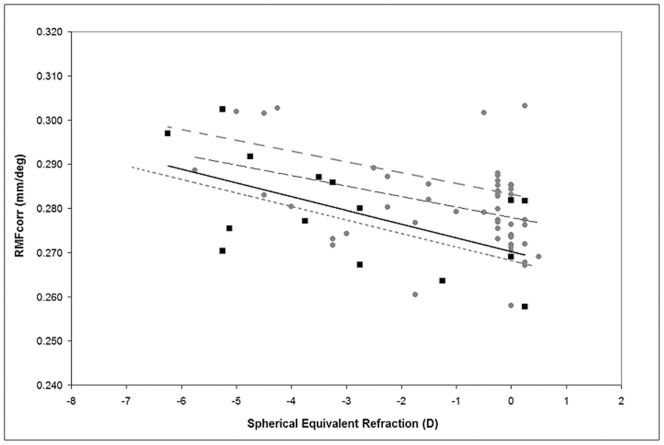
Figure 4. Spectacle corrected Retinal Magnification Factor (RMFcorr) plotted as a function of the spherical equivalent spectacle correction.
The solid line represents linear regression to data from the present work (black squares). The interrupted black line represents linear fit to aggregate data from three of our previous studies (total 62 eyes, gray dots; Lombardo M. et al. Retina, 2013; Lombardo et al. OPO, 2013; Lombardo et al. JCRS, 2013); the interrupted and dotted grey lines represent linear fits to data from Li et al. (18 eyes; IOVS, 2010) and Coletta & Watson (18 eyes; Vis Res, 2006) respectively.

