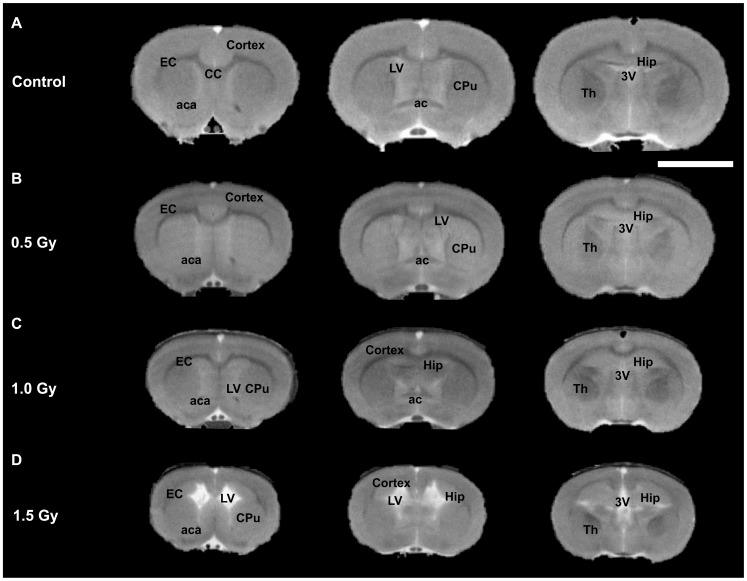
Figure 1. T2-weighted MRI (T2WI) results.
Each row: 3 T2W images representing a consecutive series of brain slices in a typical rat from one of the experimental groups. (A) The first row shows images from a typical control rat. (B) The second-row images are from a typical 0.5-Gy–irradiated rat. (C) The third-row images are from a typical 1.0-Gy–irradiated rat. (D) The bottom-row images are from a typical 1.5-Gy–irradiated rat. The brain size of the animals in the radiation-exposed groups is clearly smaller than that of the control rats. CC, corpus callosum; EC, external capsule; aca, anterior commissure anterior part; LV, lateral ventricle; 3V, 3rd ventricle; CPu, caudate-putamen; Hip, hippocampus; TH, thalamus; ac, anterior commissure; white bar, 5 mm.

