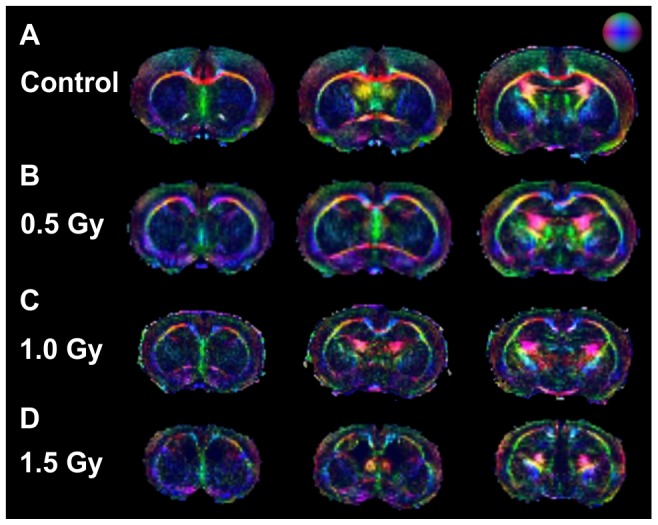
Figure 2. Typical diffusion tensor imaging (DTI) MRI results.

Each row: DTI 3-color maps representing a consecutive series of brain slices, in a typical rat from one of the experimental groups. Color maps of tracked fibers were based on the extracted primary direction (red was used for the x-direction, green for the y-direction, and blue for the z-direction). A–D; rows have the same meaning as in Figure 1.
