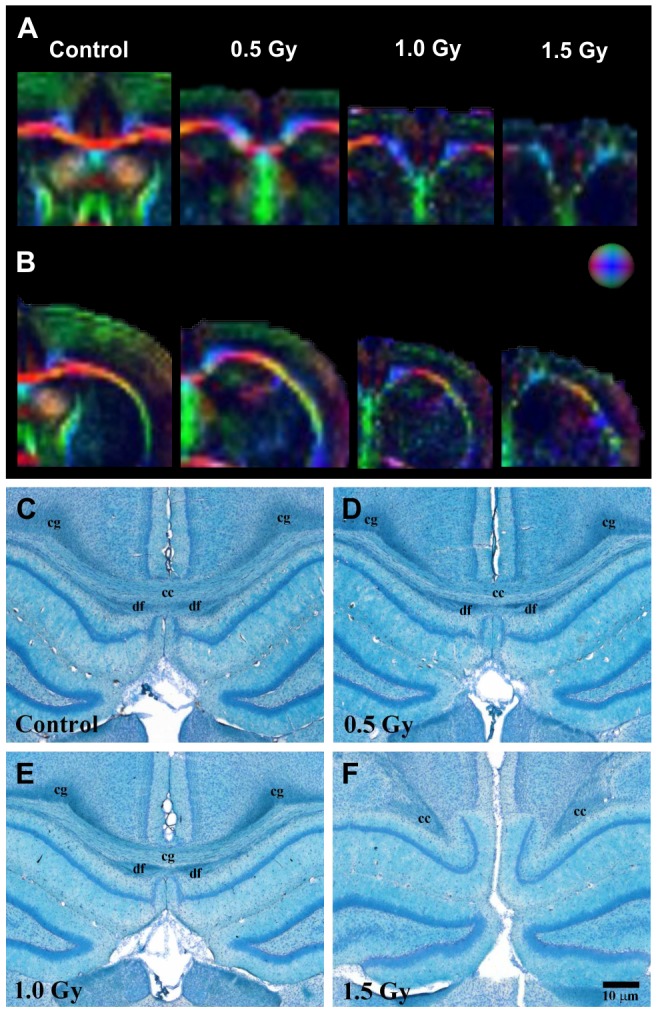
Figure 3. Typical DTI and KB-staining images.

(A) The first column of color-scale images shows typical coronal DTI rat brain images at CC. (B) The second column shows typical coronal DTI rat brain images at EC. (C) The third column shows typical KB staining images around CC. Rows have the same meaning as in previous figures. EC, external capsule; df, dorsal fornix; Cg, cingulum.
