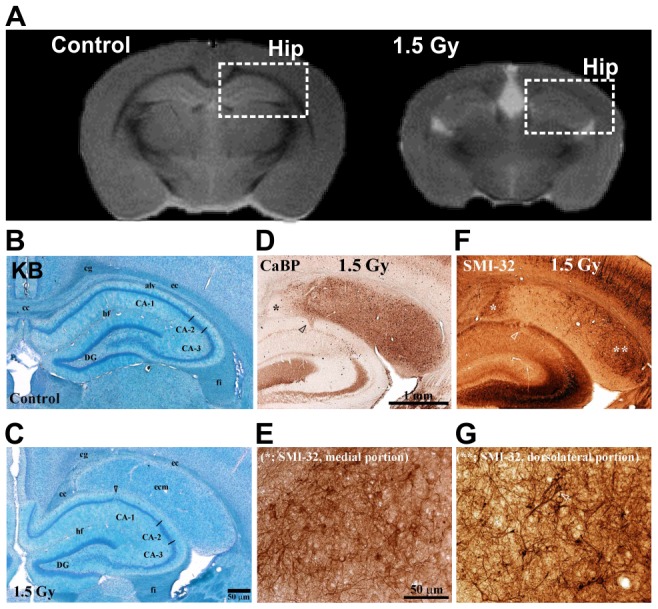
Figure 5. Histological analyses performed using KB, CaBP, and SMI-32 staining in sections of the hippocampus.

(A) Typical images around the hippocampus in sections from control and 1.5-Gy–irradiated rat brains. The upper gray-scale images show typical control and 1.5-Gy–irradiated rat T2WI results. B, C; Typical control (B) and 1.5-Gy–irradiated (C) rat KB images in sections of the hippocampus. D, E; Typical coronal CaBP images in sections of the hippocampus at low and high magnification. F, G; Typical SMI-32 images in sections of the hippocampus. Hip, hippocampus; alv, alveus of the hippocampus; hf, hippocampal fissure; ecm, ectopic neuron mass; f, fimbria of the hippocampus; DG, dentate gyrus; black bars, 50 µm in C and E, and 1 mm in D.
