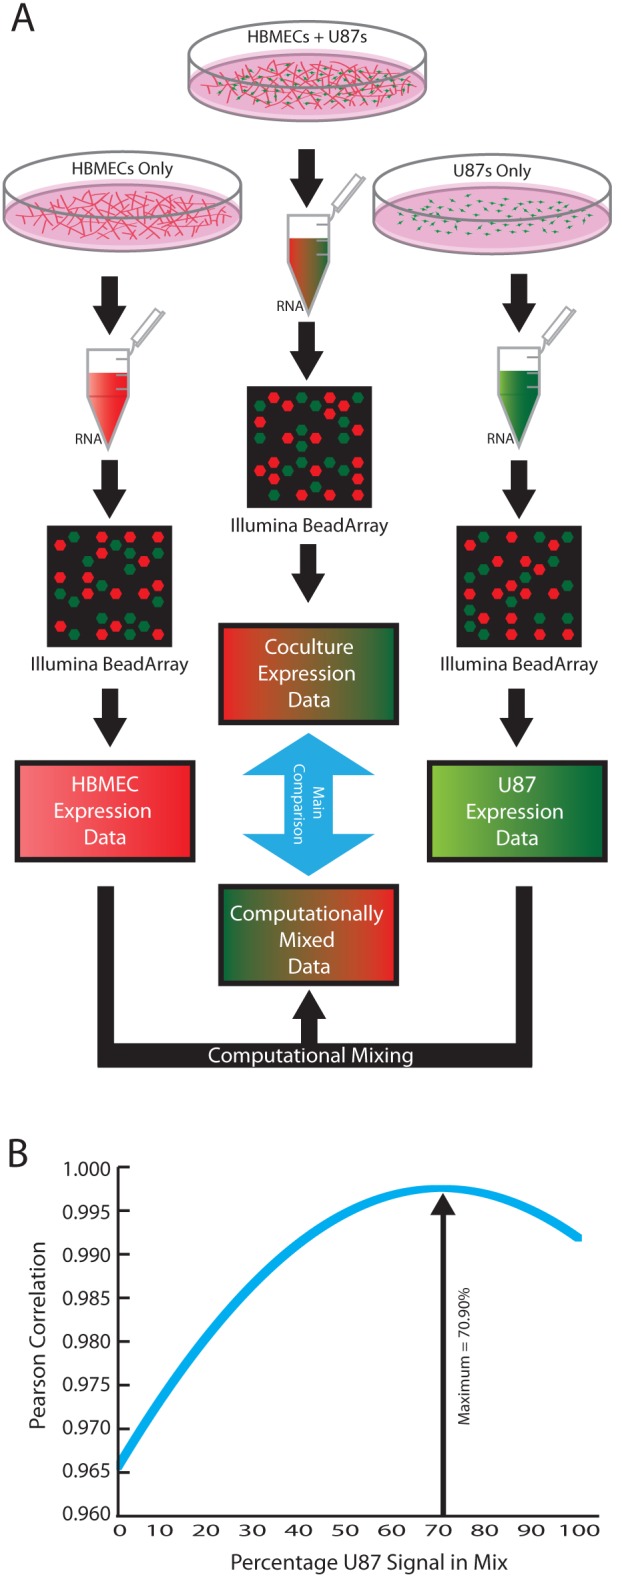
Figure 1. Sample preparation and computational deconvolution of the mixed culture RNA signal.

(A) Flow chart of sample preparation from culture to gathering RNA and computational analysis. (B) The percentage of each monoculture to use for the control dataset was determined by creating one thousand test datasets, each with a different amount of U87 or HBMEC signal, and then calculating the Pearson correlation coefficient between each of these datasets and the measured co-culture dataset.
