Figure 2.

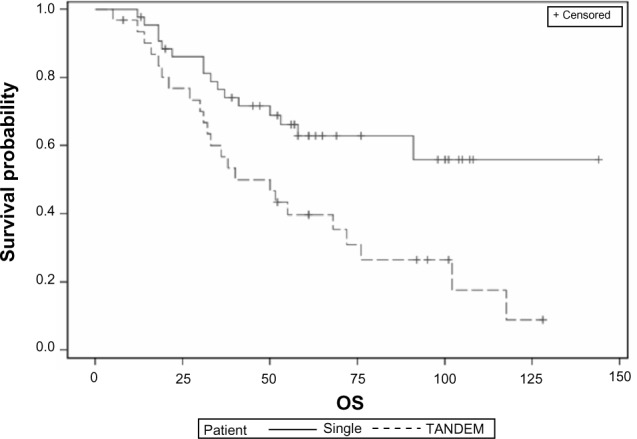
Kaplan–Meier curves showing OS in single versus tandem ASCT on intent to treat analysis (P = 0.0073). Median survival for the single group is not reached at the time of analysis.

Kaplan–Meier curves showing OS in single versus tandem ASCT on intent to treat analysis (P = 0.0073). Median survival for the single group is not reached at the time of analysis.