
Figure 5.
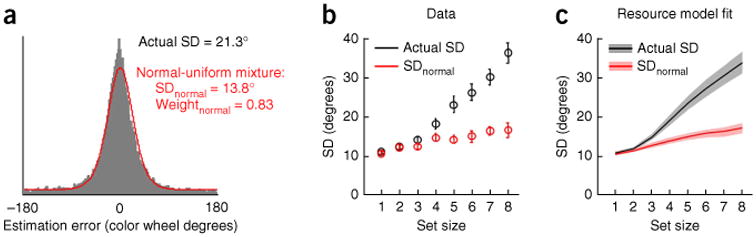
Interpreting the shape and width of working memory error distributions. (a) A crucial area of debate concerns how to model the distribution of recall errors (gray histogram, color estimation data from ref. 15, averaged over all subjects and set sizes). A popular analysis method attempts to do this with a mixture of a circular normal distribution (intended to correspond to items in memory) plus a uniform distribution (intended to correspond to items that are not stored)19. The red line depicts this fit, also averaged over all subjects and set sizes. Note that the circular standard deviation of the normal component in the mixture, SDnormal (average value given) is much lower than that of the raw data (compare actual standard deviation (actual SD) with SDnormal). The mixture does not fit human recall data well, and the interpretation of the two mixture components has therefore been called into question15,16. (b) Actual SD and SDnormal as a function of set size. SDnormal substantially underestimates the level of noise in memory, which, if all items are stored, is simply the actual SD. An apparent plateau in SDnormal (red symbols) at higher set sizes has been used to argue for slot models19,21, but such a plateau is not present in the raw data (black symbols). Data are from ref. 15. Error bars represent s.e.m. (c) A resource model in which all items are stored with variable precision accurately accounts for both actual SD and SDnormal. Thus, SDnormal by itself cannot serve to distinguish between slot and resource models69. Adapted from ref. 15; shaded areas are s.e.m. of model fits.