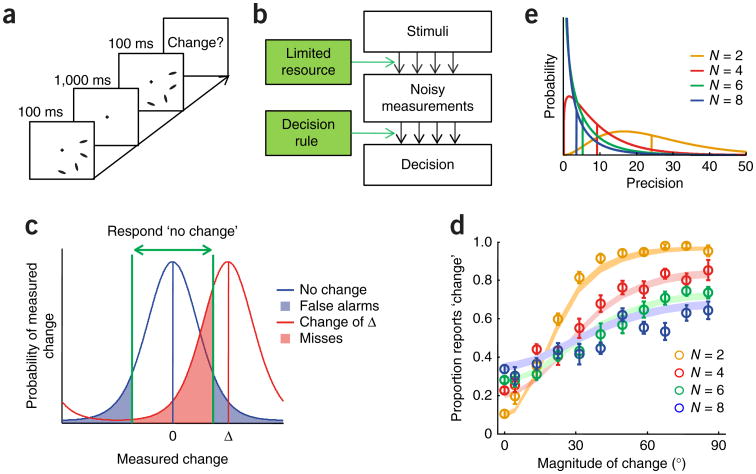
Figure 7.
Changing concepts of change detection. (a) Trial procedure in an orientation change detection task13. In contrast with previous studies, the magnitude of the change was varied on a continuum, producing a richer data set. (b) Resource model for change detection. Stimuli in both displays are internally measured in a noisy manner, and an observer applies a decision rule to these measurements to reach a judgment. To maximize accuracy, the decision rule should be based on probabilistic inference. (c) Probabilistic inference in change detection at set size 1 in a resource model, for a circular stimulus variable. The change measured by the observer follows a bell-shaped distribution centered at the true magnitude of change. The observer applies a criterion (green) to decide whether to report a change. At small magnitudes of change, D, the miss rate (red shading) might exceed 50%. Both the width of the distribution and the value of the criterion will depend on noise level and thus on set size. At higher N, the measured changes at different locations are combined nonlinearly before a criterion is applied. (d) Proportion of ‘change’ reports as a function of the magnitude of change, for each set size. Circles and error bars represent data and shaded areas represent variable-precision model with probabilistic inference. In traditional change detection studies, magnitude of change is not varied systematically and these psychometric curves cannot be plotted. (e) Probability distributions over precision in the variable-precision model, as estimated from one subject in a change detection experiment. In the equal-resource model (Fig. 2b), these distributions would be infinitely sharp. All panels except for c are adapted from ref. 13.

