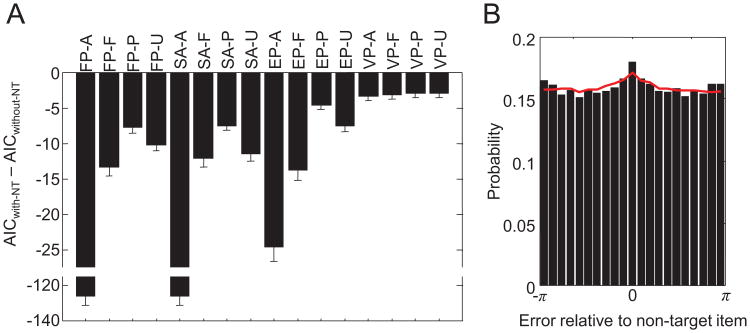
Figure 6.
Analysis of nontarget reports. A. Akaike information criterion (AIC) of each model with nontarget reports relative to its variant without nontarget reports. A negative values means that the model with nontarget reports is more likely. Error bars indicate 1 standard error of the mean. B. Histogram of response errors with respect to nontarget items, collapsed across all set sizes and subjects (bars). The bump at the center is evidence for nontarget responses and is fitted reasonably well by the VP-P-NT model (red curve). See Table 2 for the model abbreviation key.

