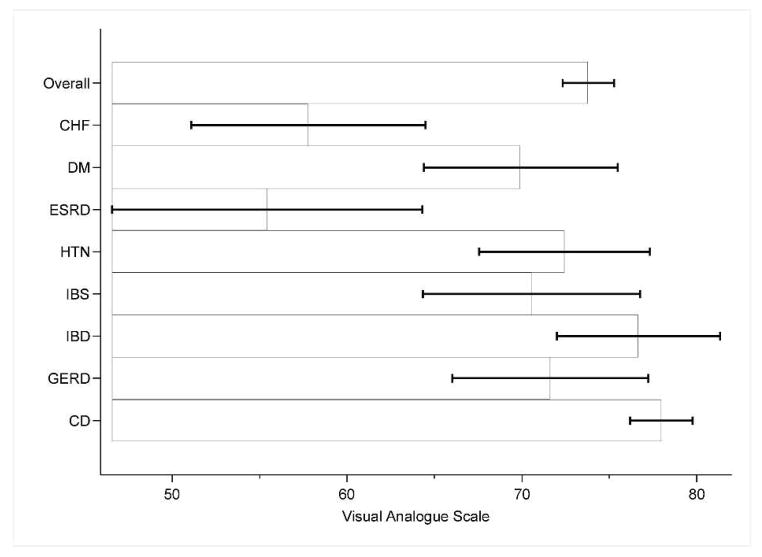
Figure 4.
Perceived overall health state of celiac disease in comparison with non-celiac chronic illnesses
*CD= Celiac disease, HTN= Hypertension, DM=Diabetes Mellitus, CHF=Congestive heart failure, ESRD=End-stage renal disease, GERD=gastroesophageal reflux disease, IBD=inflammatory bowel disease, IBS=irritable bowel syndrome
**VAS: score of zero=best imaginable health, score of one hundred=worst imaginable health
***Mean Scores: CD 78 (SD 16.7), GERD 71.6 (SD 21.6) ,HTN 72.4 (SD 20.9), IBD 76.7 (SD 19.1), CHF 57.8 (SD 21.2), IBS 70.5 (SD 18.1), DM 69.9 (SD 23), ESRD 55.4 (SD 17.8)
****Based on results of post-hoc multiple comparisons, overall health was statistically significant for the following groups: CD vs ESRD (p value 0.001), CD vs CHF (p value < 0.001), IBD vs ESRD (p value 0.014), IBD vs CHF (p value 0.001), HTN vs CHF (p value 0.029). Error bars represent 95% confidence intervals.

