Figure 4.
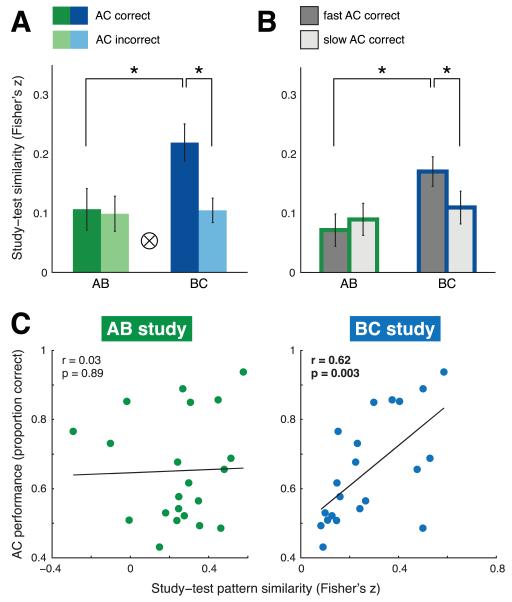
Results from multivariate neural pattern similarity analysis demonstrating an encoding signature specific to overlapping events in bilateral CA1. (a) Performance-based analysis. Study-test pattern similarity limited to triads for which both direct memory judgments (AB, BC) were correct. Trials were split based on whether the corresponding inference (AC) judgment was later correct (dark bars) or incorrect (light bars). AB-AC study-test pattern similarity is shown in green; BC-AC study-test pattern similarity is shown in blue. (b) RT-based analysis. Study-test pattern similarity for direct correct and AC inference correct triads. Trials were further split based on median reaction time into fast (dark gray bars) and slow (light gray bars) inference judgments. Bars depicting AB-AC study-test pattern similarity are outlined in green; bars for BC-AC pattern similarity are outlined in blue. For both (a) and (b), asterisks (*) denote significant follow-up paired t-tests (p < 0.05); tensor product symbol (⊗) denotes significant interaction (p < 0.01). Error bars denote across-participant SEM. (c) Cross-participant analysis. Scatterplots depict continuous relationship between study-test pattern similarity (AB-AC study-test, green; BC-AC study-test, blue) and inference performance. Best-fit lines and statistics on plots were calculated using Pearson correlation. Significant correlation at p < 0.005 denoted with bold type.

