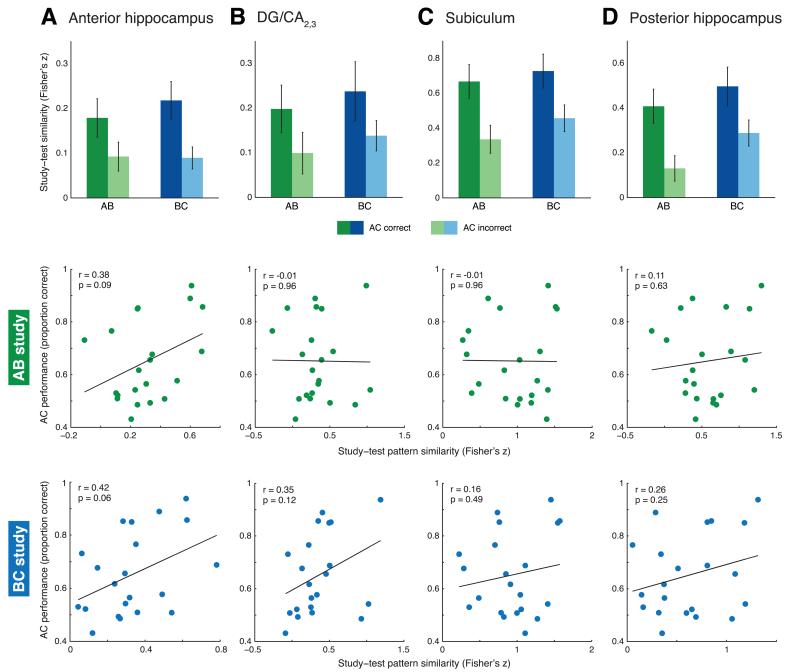
Figure 5.
Neural pattern similarity results in anterior hippocampus (a), DG/CA2,3 (b), subiculum (c), and posterior hippocampus (d). None of these regions showed evidence of a specialized BC encoding mechanism. Data are presented as in Figure 4a and c. Top charts, performance based analysis. Significant main effects of inference performance were observed in anterior hippocampus, subiculum, and posterior hippocampus (all p < 0.01; not marked on charts). Bottom scatterplots, cross-participant analysis depicting continuous relationship between study-test pattern similarity and inference performance. All correlations were non-significant at the critical p threshold of 0.005.

