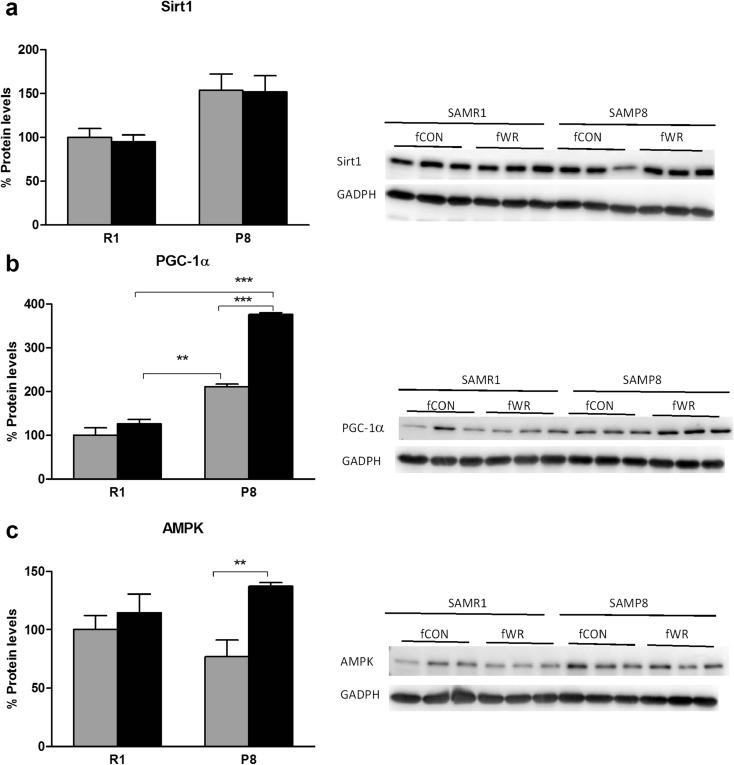
Fig. 8.
Impact of wheel running in protein levels of skeletal muscle. a Sirtuin 1. b PGC-1α and c pAMPK levels in muscle for R1, P8, sedentary-control (CON), and wheel runner (WR) female mice. Images show representative Western blot and bar graph obtained from semi-quantitative image analysis (mean ± SEM; **p < .01; ***p < .001; n = 5–6 per group)

