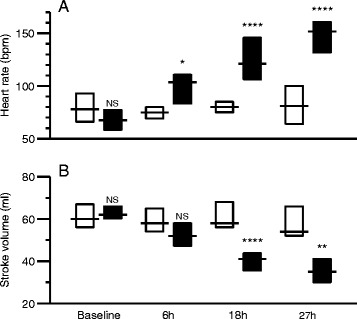
Figure 2.

Differences between control animals (white) and animals with peritonitis (black) at baseline, 6 hours, 18 hours and 27 hours after induction of sepsis. (A) Heart rate, (B) stroke volume. Boxes indicate interquartile ranges and lines indicate median values. Comparisons between control and peritonitis animals were made with Welch rank test (NS = P >0.05, * = P <0.05, ** = P <0.01, **** = P <0.0001).
