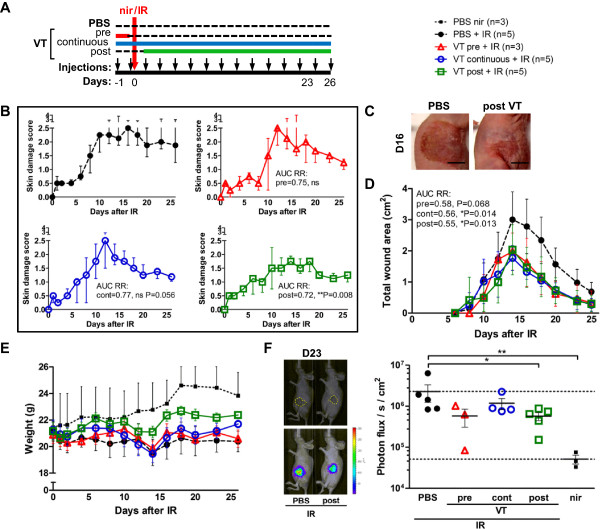
Figure 5.

Time of VT administration relative to irradiation affects the level of damage reached. (A) Schematic of 35 Gy acute skin toxicity experiment with different VT treatment schedules and data collection outline. (B) Acute skin damage scores of mice exposed to IR over time expressed as group medians ± interquartile range. (C) Representative photographs of PBS + IR vs. post VT + IR wounds on day 16. Scale bars = 1 cm. (D) Absolute surface area of wound involvement following irradiation expressed as group means ± SD. (E) Mean weights ± SEM of PBS/VT-treated irradiated and non-irradiated animals over time. Non-irradiated animals are plotted with error bars extending only upwards for a clearer view of the other groups. (F) (Left) Photograph of mice with outlined wound and overlay with bioluminescence signal. (Right) MPO bioluminescence detection 23 days after IR and 7 min after luminol injection, expressed as mean ± SEM. * and ** indicate P < 0.05 and P < 0.01, respectively, and “ns” denotes ‘not significant’.
