
Figure 1.
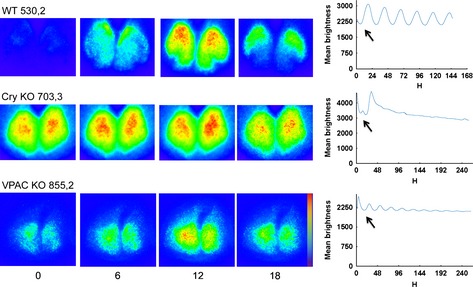
Spatiotemporal pattern in PER2::LUC bioluminescence in SCN for representative slices from WT, Cry‐null and VPAC2‐null mutant animals at 6‐h intervals. Time zero was defined as the trough of the first cycle (indicated by the black arrows). The pseudocolored images are normalised to the brightest slice. Rainbow scale (blue, low and red, high expression) is shown on the righthand side of the last panel. The mean brightness profiles are shown to the right of each row. To facilitate visualisation of differences between WT and mutant slices, the y‐axes are scaled comparably. Due to differences in the length of the brightness profiles, the scales on the x‐axis are not uniform.