
Figure 4.
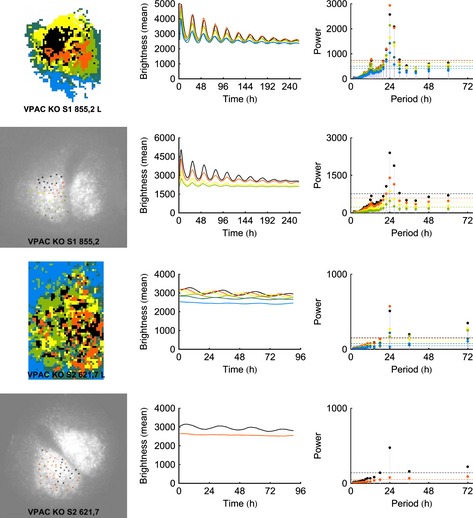
The results of the k‐medoids analysis for VPAC2‐null slices with automatically determined regions of interest (ROIs) show more variability than either WT or Cry‐null slices. The slice bearing spatial organisation has high amplitude rhythmicity while the other lacks both. For each slice, cluster analysis with manually determined ROIs is shown immediately below the automated analysis. Note that, due to differences in the length of the brightness profiles, the scales on the x‐axis are not uniform.