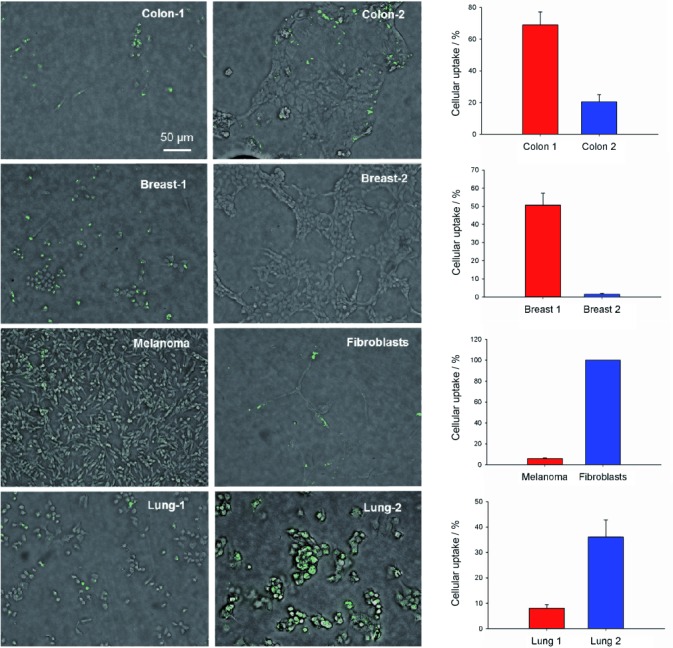
Figure 4.

Uptake of FAM-InsP5 (5) is different between cell lines. Each cell line was grown to 50 % and to 80 % confluence. The cells were treated with 5 (20 μm) for 16 h, fixed with paraformaldehyde and embedded in Fluoromount. Shown are focus stackings of bright and fluorescence light overlays of one representative micrograph at 200-fold magnification. Uptake of 5 was determined (see above) from cells grown to 50 and to 80 % confluence (from five micrographs each) and the mean values±SEM were calculated. Histograms show uptake for well differentiated (blue) and more malignant (red) cell lines.
