
Figure 5.
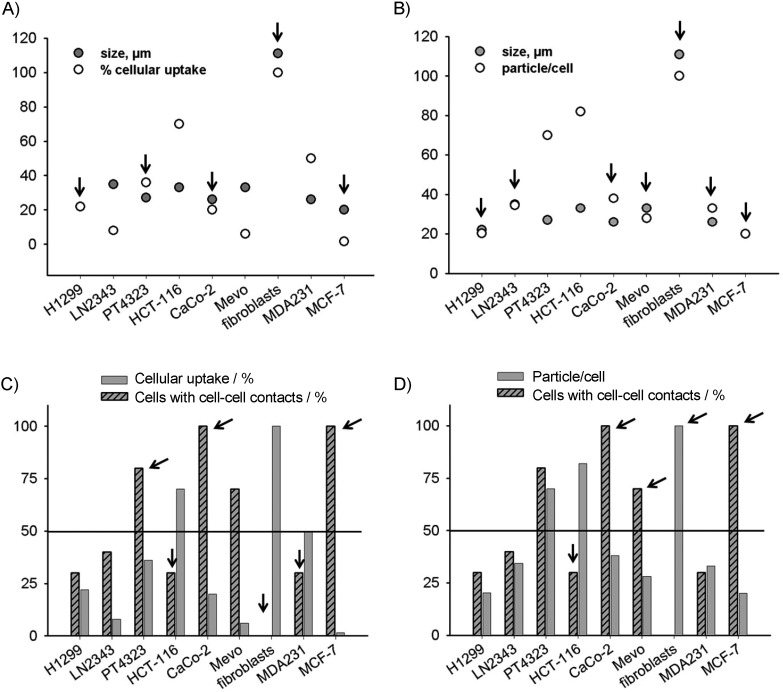
Effect of cell size and contacts on uptake of FAM-InsP5 (5). A), B) Cell size was determined, and the number of aggregates (particles) of 5 per cell was counted or percentage cellular uptake of 5 was determined as described in Figure 1. Cells lines for which cell size and uptake of 5 were correlated are marked with arrows. C), D) Percentage of cell–cell contacts was determined and plotted either against percentage uptake of 5 or against the number of particles of 5 per cell. Cells with few contacts and high uptake of 5 and cells with many contacts and low uptake of 5 are marked with arrows.