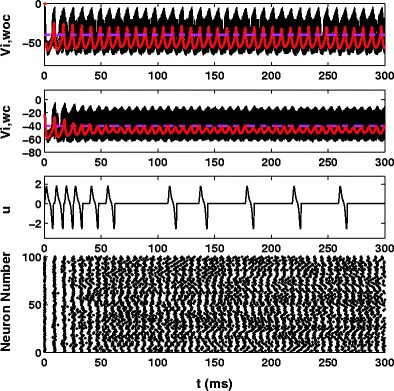
Fig. 13.

Results for a population of N=100 noisy neurons with synaptic coupling and a homogeneous distribution of distances from the probe. The first panel shows results in the absence of control. The second and third panels show results for the same network with the event-based control applied. Traces give the mean voltages for the system and the horizontal line shows the control activation threshold. Substantial desynchronization can be seen from the raster plot
