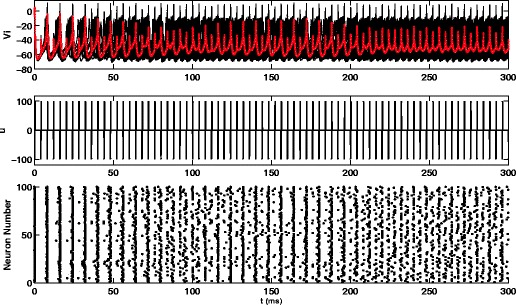
Fig. 6.

The top and middle panels show results for a population of N=100 noisy, coupled neurons with a pulsatile control. Traces give the mean voltages for the system. The raster plot shows that the pulsatile stimulus desynchronizes by splitting the network into two groups of neurons firing out of phase
