
Fig. 7.
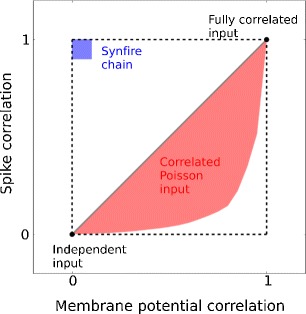
Summary of spike and membrane potential correlations for different input scenarios. The area bounded by the dashed lines represents the correlation regimes accessible by the separation of SD and NSD inputs. Further explanation in the main text (cf. Section 4)