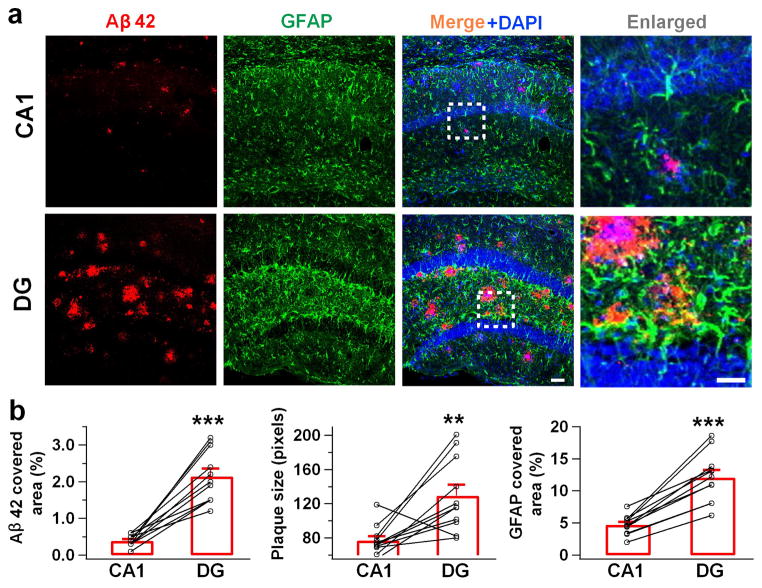
Figure 1. Dentate gyrus has more Aβ deposit and reactive astrocytes than CA1 region in the 5xFAD mice.
(a) Representative images showing more Aβ immunostaining (red) and reactive astrocytes (green) in the DG than in the CA1 region of 5xFAD mice. Blue is DAPI staining for cell nucleus. (b) Quantified data showing increased Aβ-covered area, Aβ plaque size, and GFAP-covered area in the DG compared to the CA1 region in 5xFAD mice. Bar values are shown as mean ± s.e.m., n = 11. Scale bar = 50 μm (20 μm in enlarged images). ** P < 0.01; *** P < 0.001, paired Student’s t-test.

