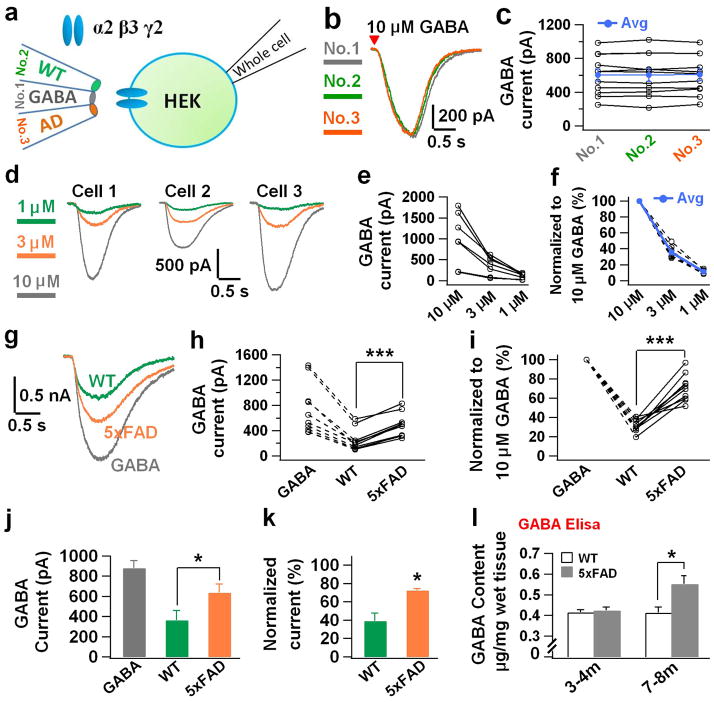
Figure 3. Brain homogenate assay detected higher GABA concentration in the hippocampal tissue of 5xFAD mice.
(a) Schematic diagram illustrating the experimental arrangement of brain homogenate puff (BHP) assay. (b, c) Triple micropipettes filled with the same concentration of GABA (10 μM) evoked the same size of GABA responses in a set of HEK cells expressing different levels of GABAA-Rs. (d–f) Triple micropipettes filled with different concentrations of GABA (1, 3, 10 μM) evoked different sizes of GABA responses in HEK cells. (g–i) A typical set of experiments showing responses evoked by WT or AD hippocampal homogenate and GABA (10 μM) in HEK cells expressing GABAA-Rs. Note that AD hippocampal homogenate always evoked larger GABA responses in the same cell than that from WT littermate. (j, k) Quantitative data showing increased GABA current amplitude evoked by hippocampal homogenate from 5xFAD mice compared to that from WT mice (n = 3 sets, total 24 cells). (l) GABA ELISA assay showing that GABA concentration in the hippocampal tissue increased significantly in old 5xFAD mice (7–8 months, n = 5 mice for WT; n = 4 mice for 5xFAD), but not in young animals (3–4 months, n = 6 mice for WT; n = 5 mice for 5xFAD). Note that GABA concentration did not change in WT animals. Data are presented as mean ± s.e.m., * P < 0.05; ** P < 0.01; *** P < 0.001; Student’s t test.

