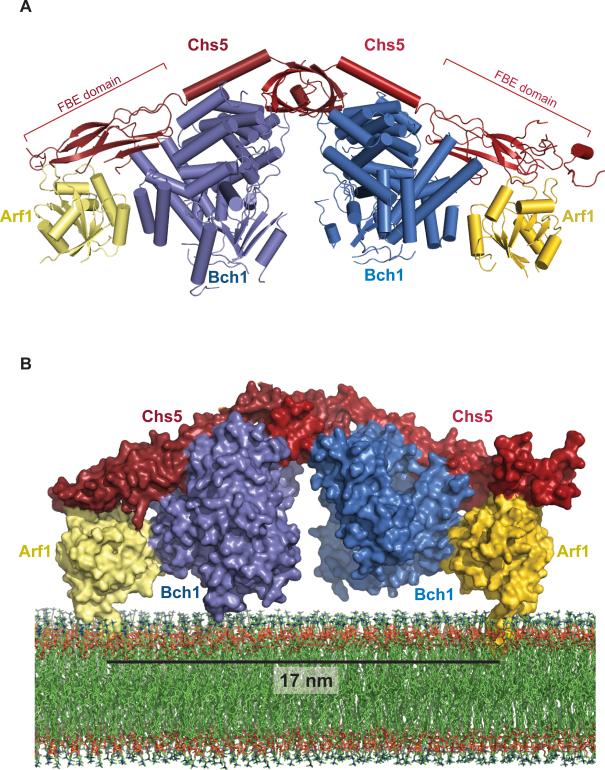
Figure 1. Crystal Structure of the Exomer-Arf1 complex.
A) The crystal structure of exomer bound to Arf1 shown as a ribbon diagram. Chs5 is shown in red, Bch1 in blue, and ΔN17-Arf1-GMPPNP in gold. Residues 1-274 of Chs5 constitutes a functional fragment (Paczkowski et al., 2012). Chs5 residues 170-299 were not resolved in the crystal structure.
B) Space-filling model of exomer and Arf1 bound to membranes, generated by superimposing the structure of full-length Arf1-GTP bound to lipids (Liu et al., 2010) onto ΔN17-Arf1-GMPPNP in the complex. The lipid bilayer was derived from a previous study (Heller et al., 1993).

