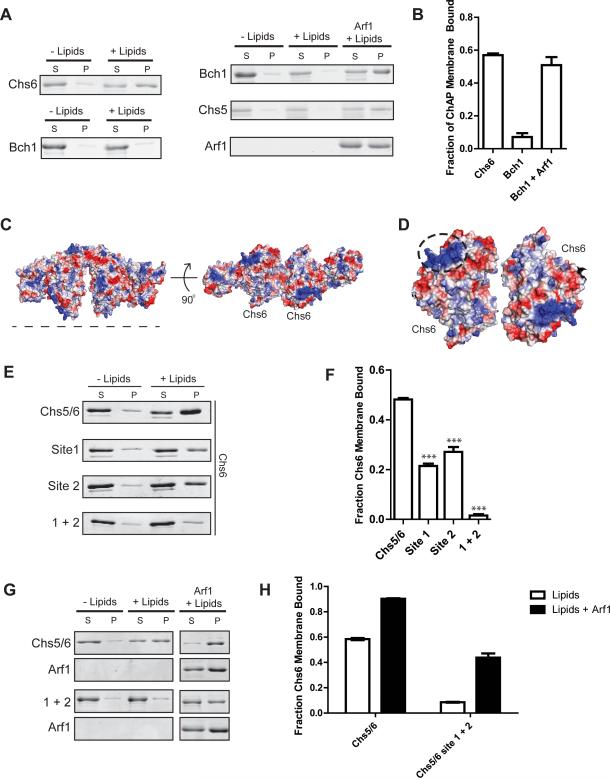
Figure 3. ChAP subunits bind membranes with different affinities.
A) Liposome pelleting assays comparing membrane binding affinity of Chs5(1-299)/Chs6 to that of Chs5(1-299)/Bch1 (left side). Chs5/Bch1 binding to membranes is detectable only when Arf1 is present (right side).
B) Quantification of the data shown in panel (A), n = 3.
C) Electrostatic surface potential of the modeled Chs5/Chs6/Arf1 complex, generated by superimposing the structure of Chs6 (Paczkowski et al., 2012) onto Bch1. Blue indicates positive potential, red indicates negative potential. The dotted line represents the proposed membrane-binding interface. A similar analysis of Bch1 was not practical, due to a significant number of residues in disordered loops on this surface.
D) View of the membrane binding surface of two Chs6 subunits, with the dashed circle highlighting the locations of site 1 and 2 comprising the positively charged cluster.
E) Liposome pelleting assay testing Chs5(1-299)/Chs6 membrane binding surface mutants. Site 1, K86A/H87A/K89A. Site 2, R446A/K449A. 1+2 is a combination of both sites.
F) Quantification of the data from panel (E), n = 3.
G) Liposome pelleting assay to test Arf1-dependent membrane binding of Chs5(1-299)/Chs6 mutants.
H) Quantification of the data from panel (A), n = 3.

